본문으로 바로가기
Ess-neofab

A line- and system-level record of ESS and secondary-battery manufacturing processes

  • 한국어
  • English
  • Home
  • Process
  • System
  • Interface
  • Traceability
  • News & Trends
  • About
  • Contact
  • 한국어
  • English
  • Home
  • Process
  • System
  • Interface
  • Traceability
  • News & Trends
  • About
  • Contact

카테고리

  • Interface (28)
  • News & Trends (20)
  • Process (32)
  • System (31)
  • Traceability (22)

최근 글

  • Five million ACC cells equal 2.7 to 3.6 months of nameplate outputOctober 15, 2026
  • A 160 MW battery’s six-week commissioning has two baselinesOctober 8, 2026
  • Two Cycles a Day Take 106.8 % of a Day, and the Retention Tier Shifts Cell Volume by 1.47 GWhOctober 1, 2026
  • Battwoo’s Second-Life EV Batteries — When an 80 % Acceptance Threshold Overlaps the Retirement Distribution, Incoming Screening Becomes the BottleneckSeptember 30, 2026
  • US storage set an energy record in Q2 as installed power fell 7%September 29, 2026
  • CATL Starts Trial Production in Debrecen — The Digits of the Defect-Rate Target, Not the Equipment, Set the Length of a Trial RunSeptember 29, 2026
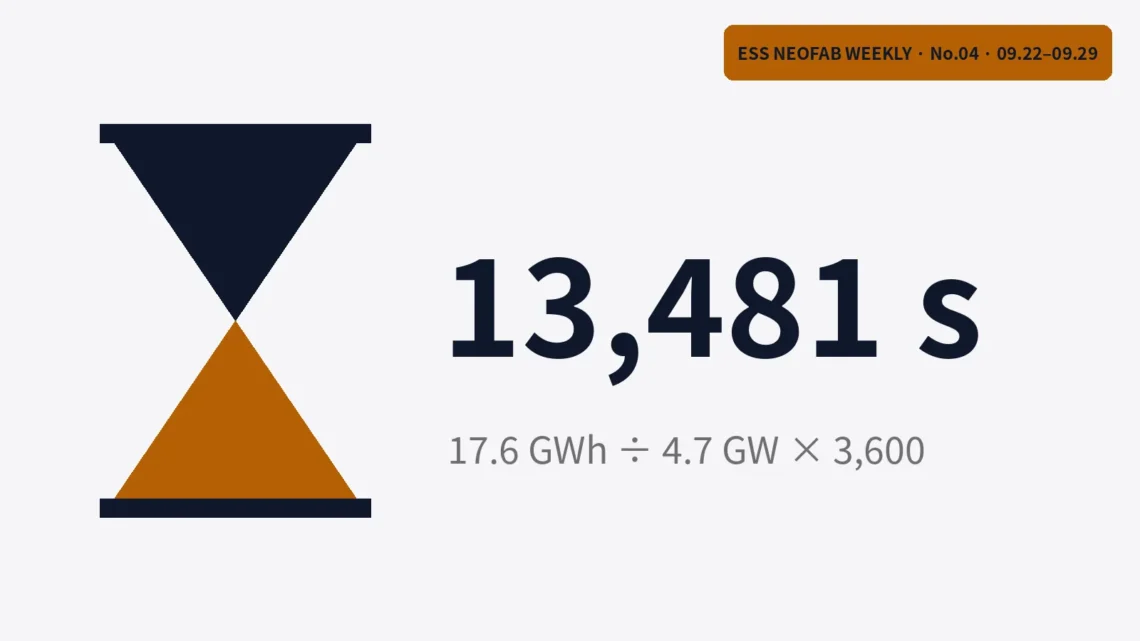
  • Hourglass graphic with the Q2 2026 US utility-scale storage duration of 13,481 s and its formula
    Process,  System

    US storage set an energy record in Q2 as installed power fell 7%

    September 29, 2026 /

    The US installed a record 18.9 GWh of energy storage in the second quarter of 2026, yet installed power fell 7% from a year earlier. Duration, the energy divided by the power, got longer, and for utility-scale projects it reached 13,481 s (about 3.74 hours). If duration stretches to the 14,788 s average in the 2026–2031 outlook, a 10% rise in energy calls for only 0.3% more PCS capacity. Battery lines follow GWh and PCS-transformer lines follow GW, and each conversion unit carries a larger share as duration grows.
    read more
    ESS-neofab 0 Comments

    You May Also Like

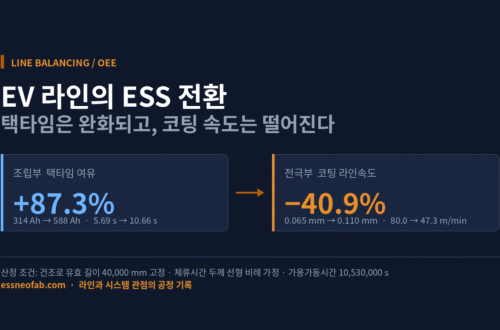
    EV 라인의 ESS 전환 시 조립부 택타임 여유 87.3% 증가와 코팅 라인속도 40.9% 하락을 비교한 라인 밸런싱 도식

    Converting EV Lines to ESS: Where Does OEE Break Down?

    August 19, 2026
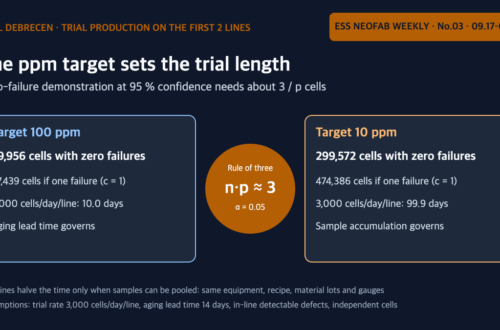
    CATL 데브레첸 시험생산에서 목표 불량률 100 ppm과 10 ppm의 무고장 입증 표본 수와 시험생산 기간 비교 도식

    CATL Starts Trial Production in Debrecen — The Digits of the Defect-Rate Target, Not the Equipment, Set the Length of a Trial Run

    September 29, 2026
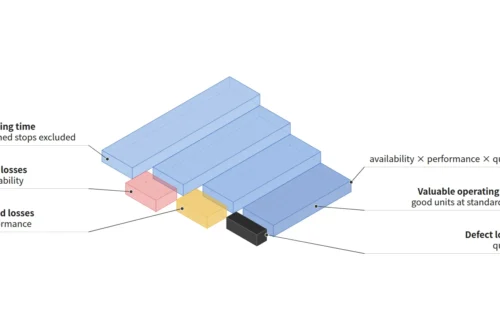
    Isometric concept of translucent blocks stepping down from loading time through stop, speed and defect losses to valuable operating time

    If Availability, Performance and Quality Are All 80 %, OEE Is 51.2 % — How to Calculate OEE

    September 25, 2026
© 2026 Ess-neofab · A line- and system-level record of ESS and secondary-battery manufacturing processes
  • About
  • Contact
  • Privacy Policy
  • Disclaimer
Ashe Theme by WP Royal.