System
This category covers how form factor and material characteristics affect equipment configuration and logistics flow across the entire value chain.
-
A 160 MW battery’s six-week commissioning has two baselines
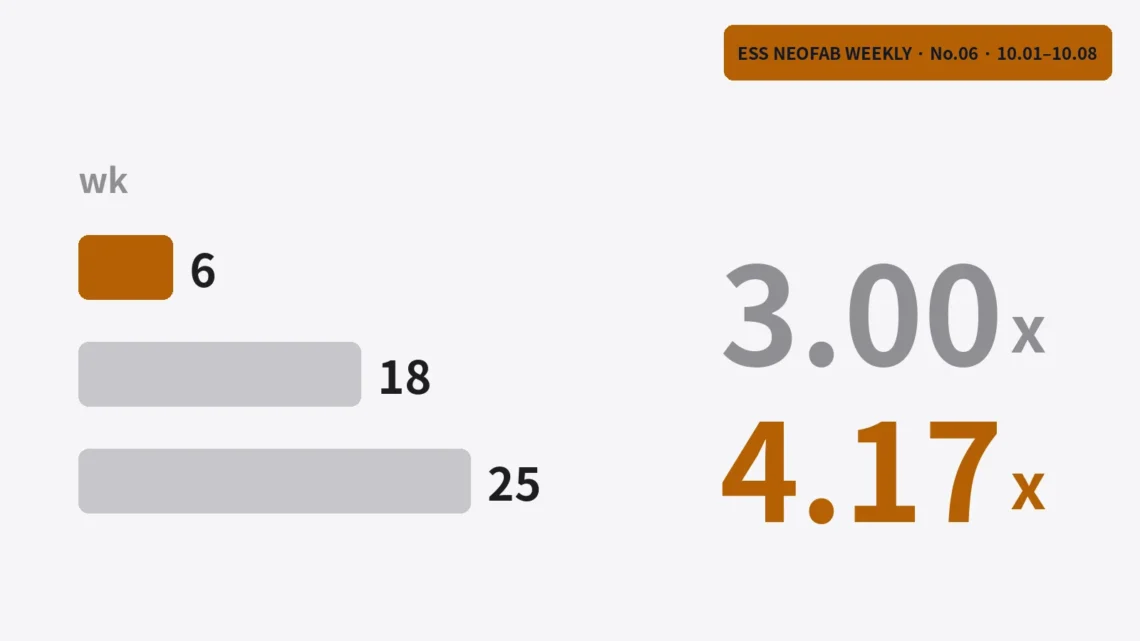
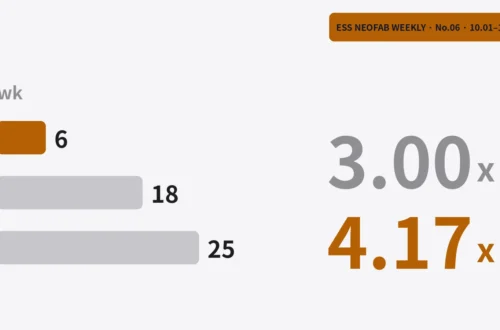
Two different baselines hang on the six-week commissioning of a 160 MW/320 MWh battery in Texas. One report says deployment time fell threefold against the original plan, and another compares the six weeks with a typical 25 weeks or more, so the baselines sit 7 weeks apart (18 and 25) and the multiples split into 3.00 and 4.17. Of roughly 16 months from groundbreaking to start-up (69.6 weeks), the six weeks make up 8.6 %, and the site announced operation 10.1 weeks after the last day of its target quarter. However the planned commissioning length is assumed, the delay that built up before commissioning stays at 4.1 weeks or more,…
You May Also Like
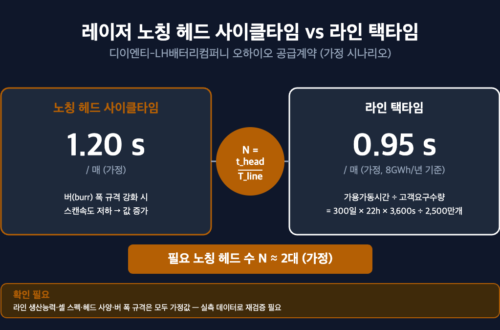
The Interface Between Laser Notching Cycle Time and Line Takt Time — The Head-Count Sizing Problem Revealed by DI ENT’s Ohio Supply Contract
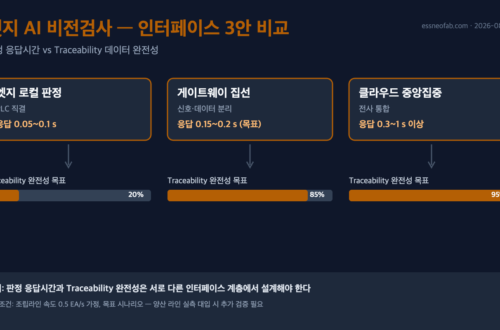
Edge AI Vision Inspection and Battery-Pack Leak Testing: How Gateway Aggregation Affects Traceability Completeness
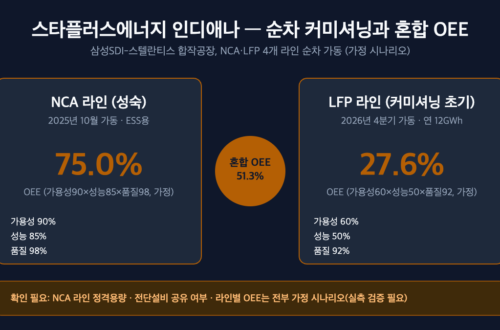
StarPlus Energy’s Indiana Plant — The Blended-OEE Illusion Created by Sequential NCA/LFP Commissioning
-
Two Cycles a Day Take 106.8 % of a Day, and the Retention Tier Shifts Cell Volume by 1.47 GWh
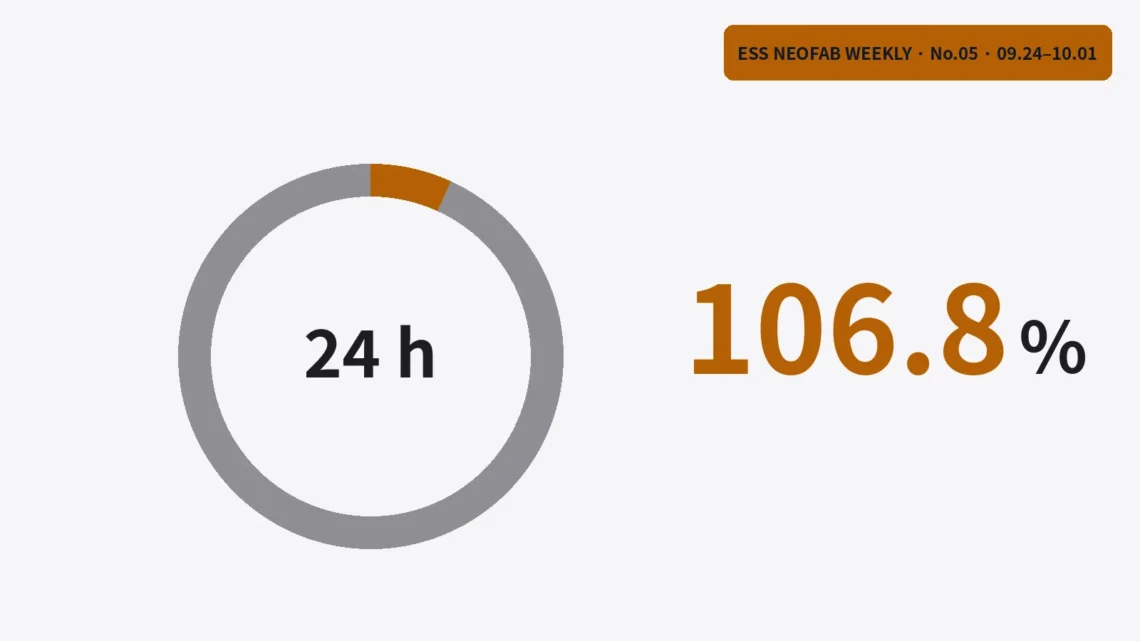
Korea's 25-year Jeju contract asks for at least 730 charge and discharge cycles a year from an 80 MW, 480 MWh system that runs for 21,600 s (6 hours) at full power. If each cycle is a full one and round-trip efficiency is assumed at 0.88, two cycles a day take 92,291 s, which is 106.8 % of the 86,400 s in a day. The warranty-life score pays 7 points for 90 % or more capacity at contract end and 1.75 points for 75 to 80 %. With no cells allowed to be added mid-term, the mainland's 6.6 GWh needs between 7.33 and 8.80 GWh of installed cells, a gap…
You May Also Like
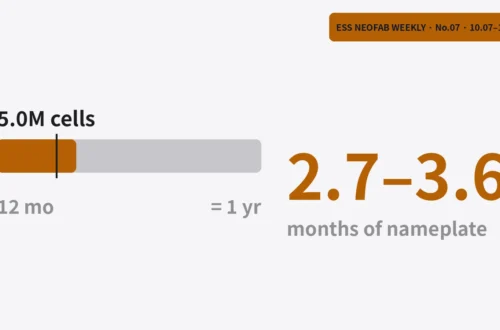
Five million ACC cells equal 2.7 to 3.6 months of nameplate output

Market Trends from a Battery Process/Equipment Perspective — 46-Phi Ramp-Up, Dry Process, Equipment In-Housing
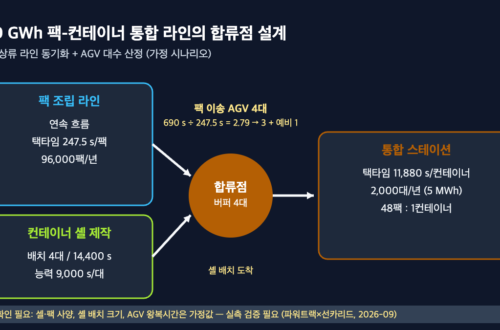
Designing the Merge Point in a 10 GWh Pack-Container Integration Line: Synchronizing Two Upstream Lines and Sizing AGV Fleet from the Powertrac × Sunka Lead Order
-
US storage set an energy record in Q2 as installed power fell 7%
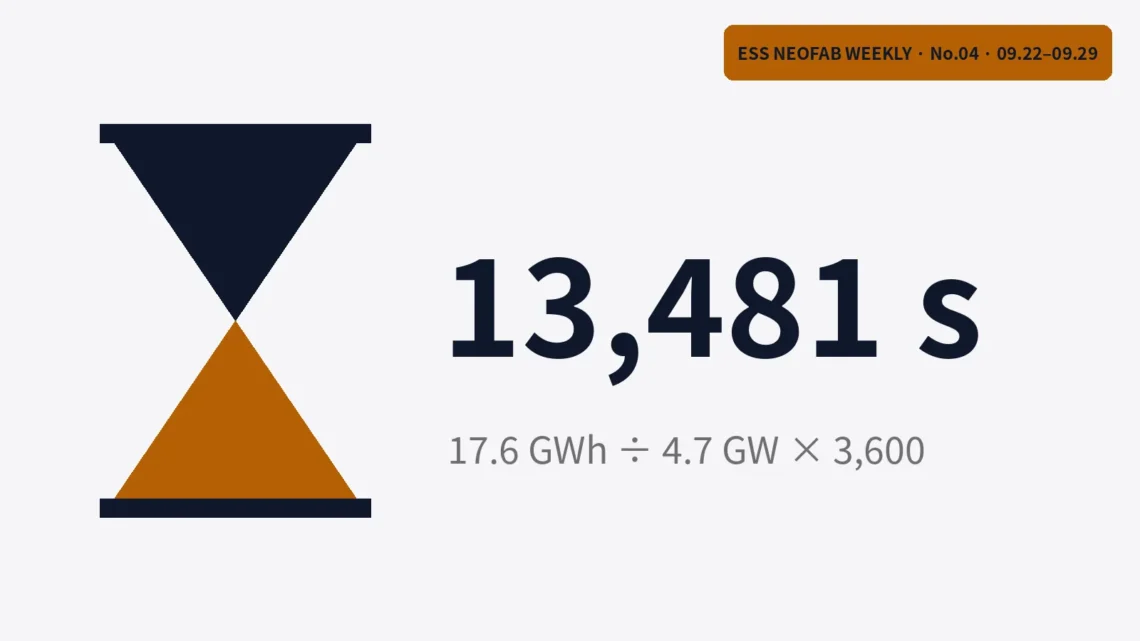
The US installed a record 18.9 GWh of energy storage in the second quarter of 2026, yet installed power fell 7% from a year earlier. Duration, the energy divided by the power, got longer, and for utility-scale projects it reached 13,481 s (about 3.74 hours). If duration stretches to the 14,788 s average in the 2026–2031 outlook, a 10% rise in energy calls for only 0.3% more PCS capacity. Battery lines follow GWh and PCS-transformer lines follow GW, and each conversion unit carries a larger share as duration grows.
You May Also Like
CATL Starts Trial Production in Debrecen — The Digits of the Defect-Rate Target, Not the Equipment, Set the Length of a Trial Run
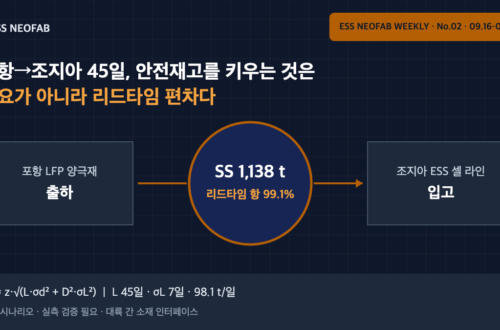
45 Days from Pohang to Georgia — Safety Stock at an Intercontinental Cathode Interface Is Driven by Lead-Time Variability, Not Demand
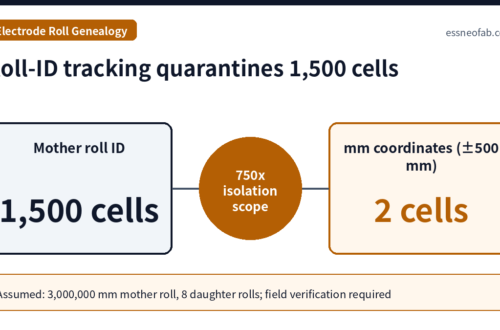
Electrode Roll Genealogy: How Key Reissue at Slitting and Stacking Shrinks Defect Isolation from 1,500 Cells to 2
-
CATL Starts Trial Production in Debrecen — The Digits of the Defect-Rate Target, Not the Equipment, Set the Length of a Trial Run
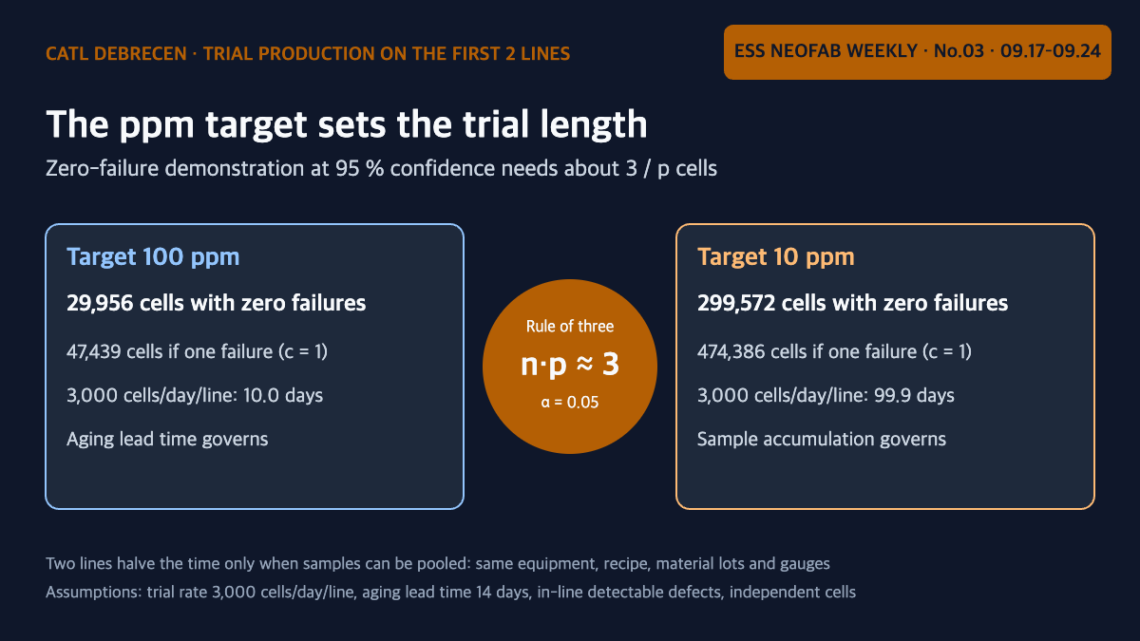
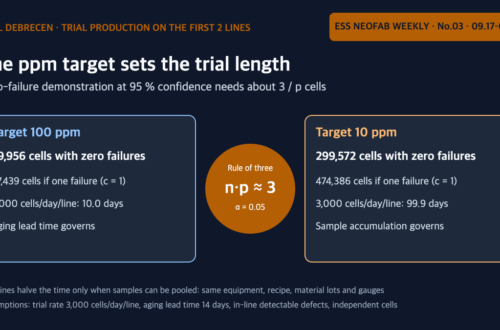
On September 22, 2026, CATL started trial production on the first two production lines of its cell plant in Debrecen, Hungary, stating that the purpose is "to set up, optimise and validate the production equipment and manufacturing processes ahead of series production"¹. If validation is defined as demonstrating a defect rate, a zero-failure demonstration at 95 % confidence requires 29,956 cells for 100 ppm and 299,572 cells for 10 ppm. Compared with an assumed aging-judgment lead time of 14 days, aging governs the trial length at a 100 ppm target, while sample accumulation governs it at 10 ppm. The second line halves the time only when samples are pooled, and…
You May Also Like
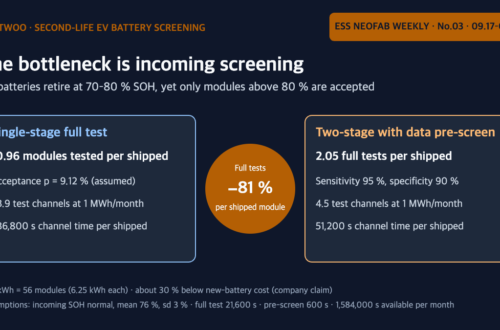
Battwoo’s Second-Life EV Batteries — When an 80 % Acceptance Threshold Overlaps the Retirement Distribution, Incoming Screening Becomes the Bottleneck
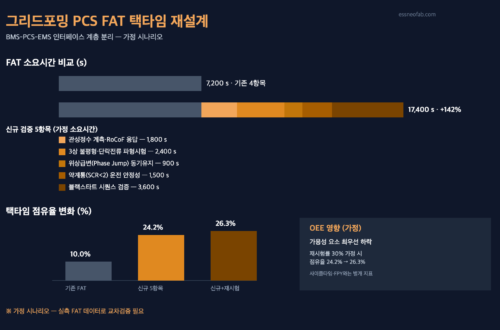
Grid-Forming PCS Mandate Redesigns FAT Takt Time and the BMS-PCS-EMS Interface
Market Trends from a Battery Process/Equipment Perspective — 46-Phi Ramp-Up, Dry Process, Equipment In-Housing
-
Pylontech’s 588 Ah and 601 Ah LFP Cells Enter Mass Production — Why Energy-Weighted Availability Stays the Same When the Cell Count Halves
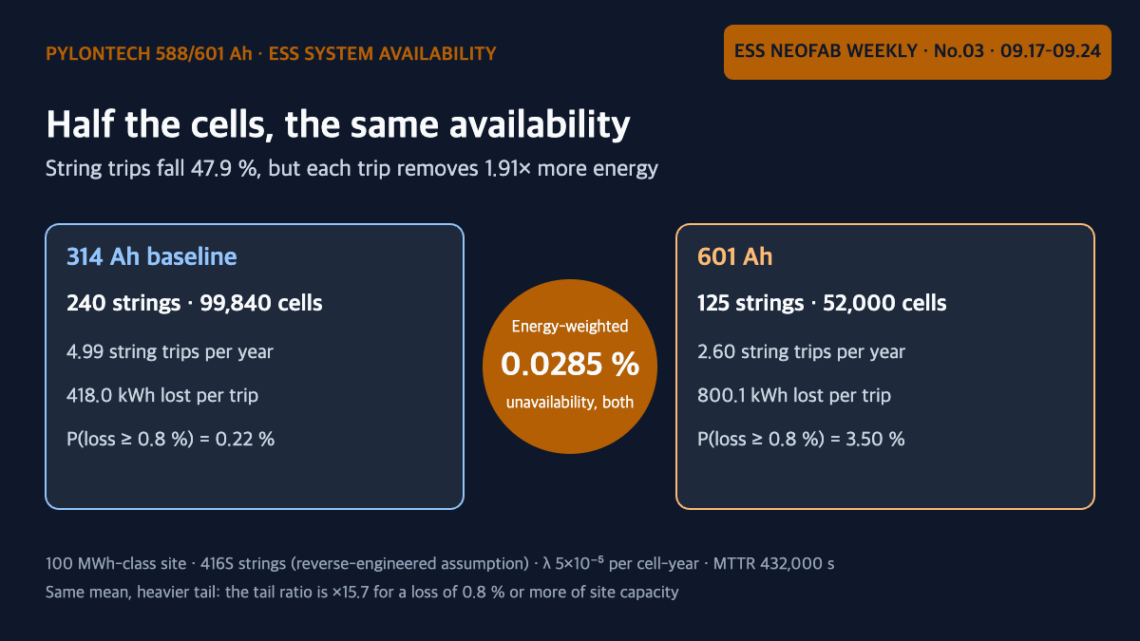
On September 21, 2026, Pylontech began mass production of 588 Ah and 601 Ah prismatic LFP ESS cells at its Hefei base and named "fewer cells and interconnections" as a benefit of the larger format¹. Under a reverse-engineered assumption of 416S strings, a 100 MWh-class site drops from 99,840 cells to 52,000 cells (−47.9 %), and string trips caused by cell-count-proportional faults fall at the same rate. Each trip, however, now removes 800.1 kWh instead of 418.0 kWh (1.91×), so the energy-weighted unavailability stays at 0.0285 % regardless of cell capacity. The mean is unchanged and only the tail gets heavier: the probability of losing 0.8 % or more of…
You May Also Like
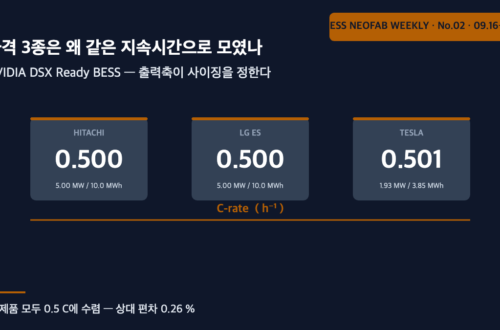
Why three qualified products landed on the same duration — in DSX Ready BESS, sizing is set by the output axis
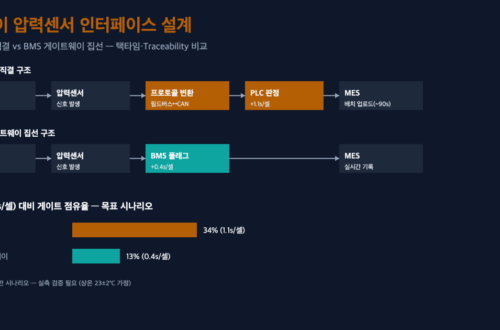
46-Phi Cylindrical Cell Line Conversion: The Pressure-Sensor–BMS Interface Determines Takt Time
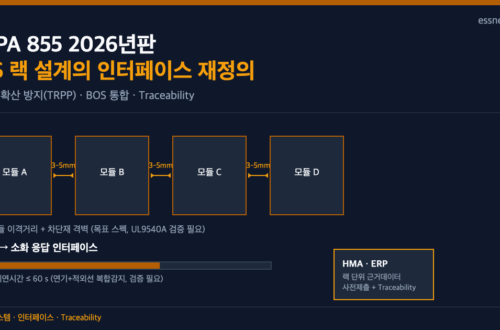
The 2026 Edition of NFPA 855 Changes ESS Rack Design and Traceability Documentation at the Same Time
-
16 GWh committed and 190 GWh reserved — what absorbs the 2.97x step is the contract, not the line
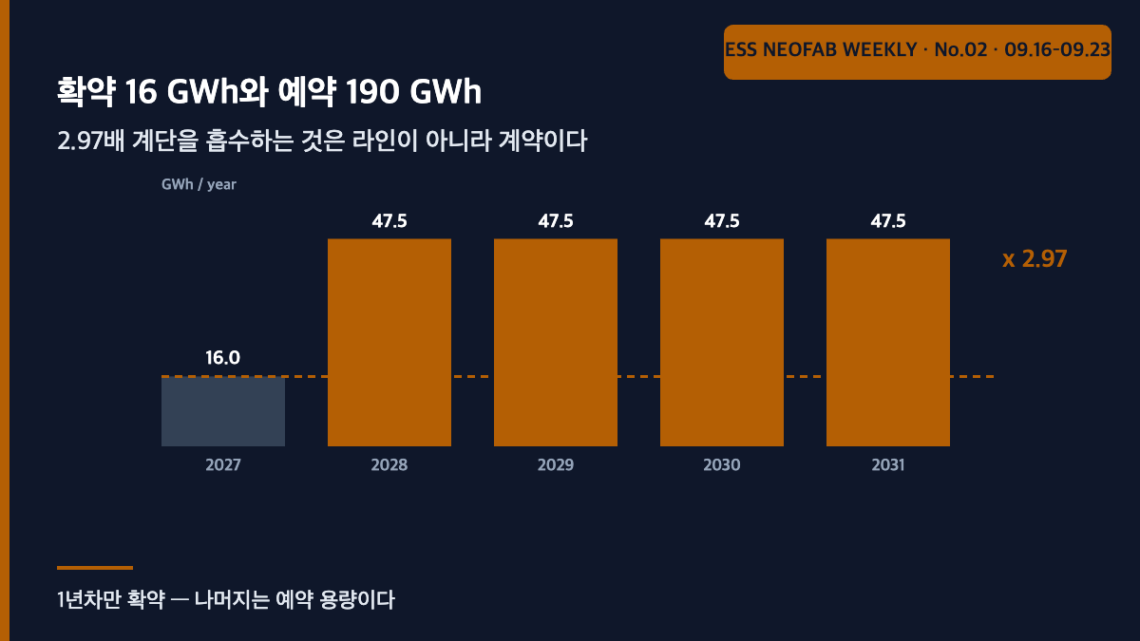
The EVE Energy - Fluence framework of up to 206 GWh for 2027-2031 turns on how it is split: only 16 GWh for 2027 is committed, the remaining 190 GWh is reserved capacity. At an assumed 6 GWh/yr per line that is a 2.97x step from three lines to eight - five more within a year - yet backing out an 18-month lead time shows the step was already 2.6 months late at disclosure. What absorbs the step is the contract wording, not the line.
You May Also Like
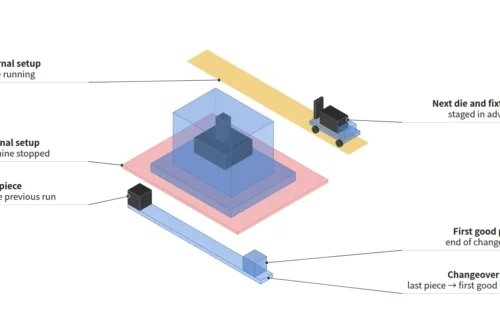
Is a Changeover Planned Downtime or an Availability Loss? — How the Definition Changes OEE
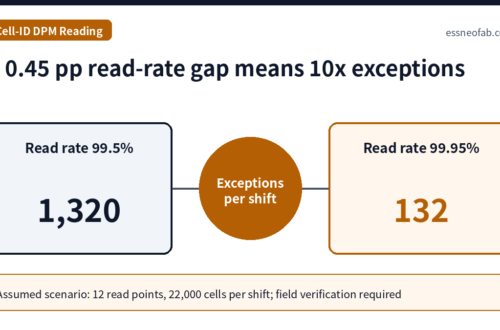
Cell-ID Laser DPM Read Rate 99.5% vs 99.95%: How No-Reads Drive Exceptions per Shift and OEE
Market Trends from a Battery Process/Equipment Perspective — 46-Phi Ramp-Up, Dry Process, Equipment In-Housing
-
FAT and SAT Differ in More Than Location — How IEC 62381:2024 Defines the Tests
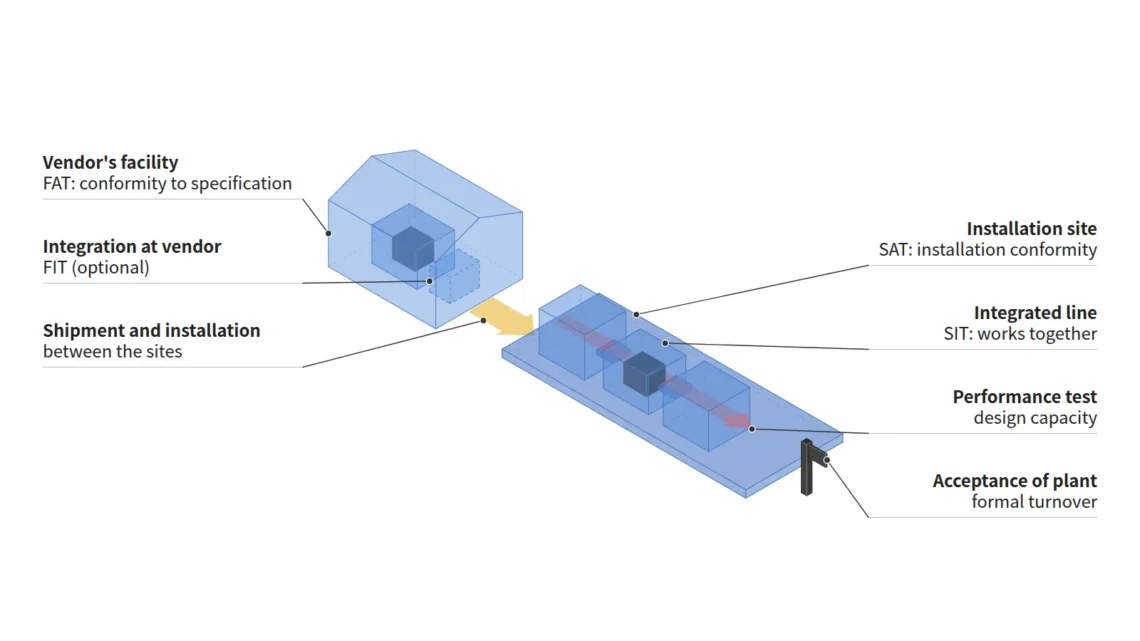
IEC 62381:2024 defines the factory acceptance test (FAT) as an activity to demonstrate that the automation system is in accordance with the specification, typically conducted at the vendor's facility, and the site acceptance test (SAT) as an activity to demonstrate, at the site of the installation, that the installation is in accordance with the applicable standards, codes, specifications, and installation instructions. The two tests differ not only in location but also in what they demonstrate, and the 2024 edition adds the optional factory integration test (FIT) and defines requirements and checklists for the FAT, FIT, SAT, and site integration test (SIT). Loop checks and commissioning lie outside the scope of…
You May Also Like
Grid-Forming PCS Mandate Redesigns FAT Takt Time and the BMS-PCS-EMS Interface
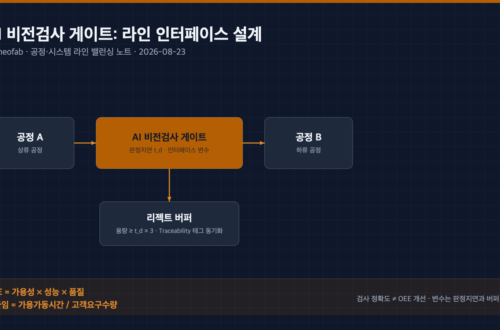
Embedding an AI Vision Inspection Gate in the Line: Redefining OEE and Takt-Time Design Variables
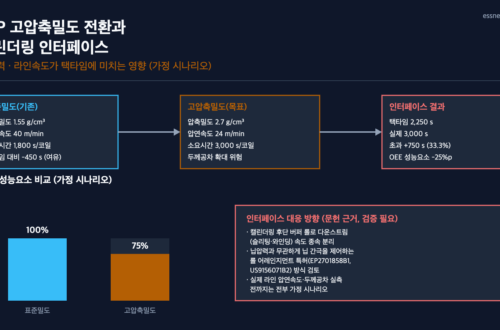
LFP High-Compaction-Density Conversion and the Calendering Interface: How Nip Pressure and Line Speed Affect Takt Time
-
If Availability, Performance and Quality Are All 80 %, OEE Is 51.2 % — How to Calculate OEE
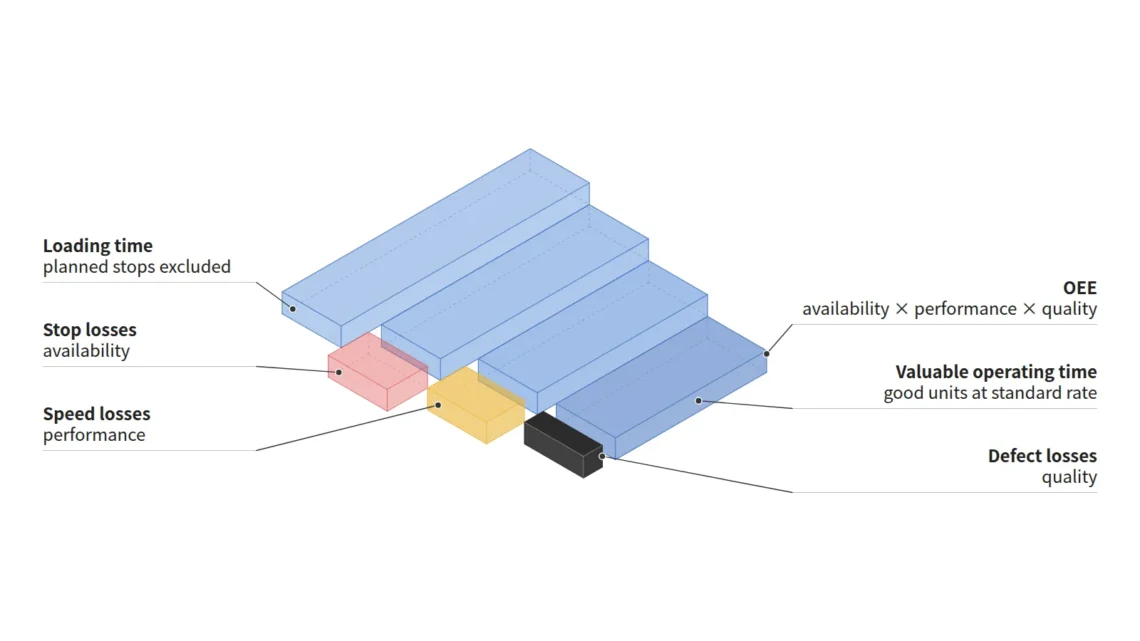
OEE (overall equipment effectiveness) is calculated as availability × performance × quality, and the Japan Institute of Plant Maintenance (JIPM) gives the example that when all three factors are 80 %, OEE is 51.2 %. When the three factors are multiplied as JIPM defines them, OEE is organized as "standard (planned) cycle time × number of good units ÷ loading time," that is, the share of loading time spent making good units at the standard speed. In an assumed shift (loading time 27,600 s, standard cycle time 32 s, 690 good units), availability is 90.0 %, performance 90.4 % and quality 98.3 %, giving an OEE of 80.0 %. If…
You May Also Like
Embedding an AI Vision Inspection Gate in the Line: Redefining OEE and Takt-Time Design Variables
Designing the Merge Point in a 10 GWh Pack-Container Integration Line: Synchronizing Two Upstream Lines and Sizing AGV Fleet from the Powertrac × Sunka Lead Order
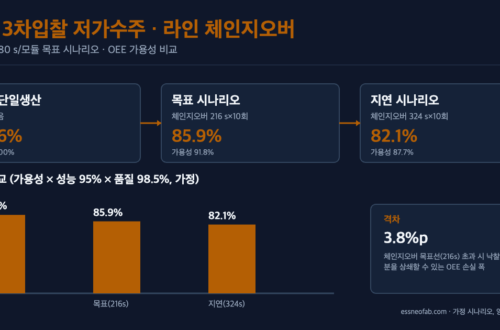
Line Changeover Design in the Era of Low-Price ESS Round-3 Bidding — Flexible Assembly Viewed Through Takt Time and OEE
-
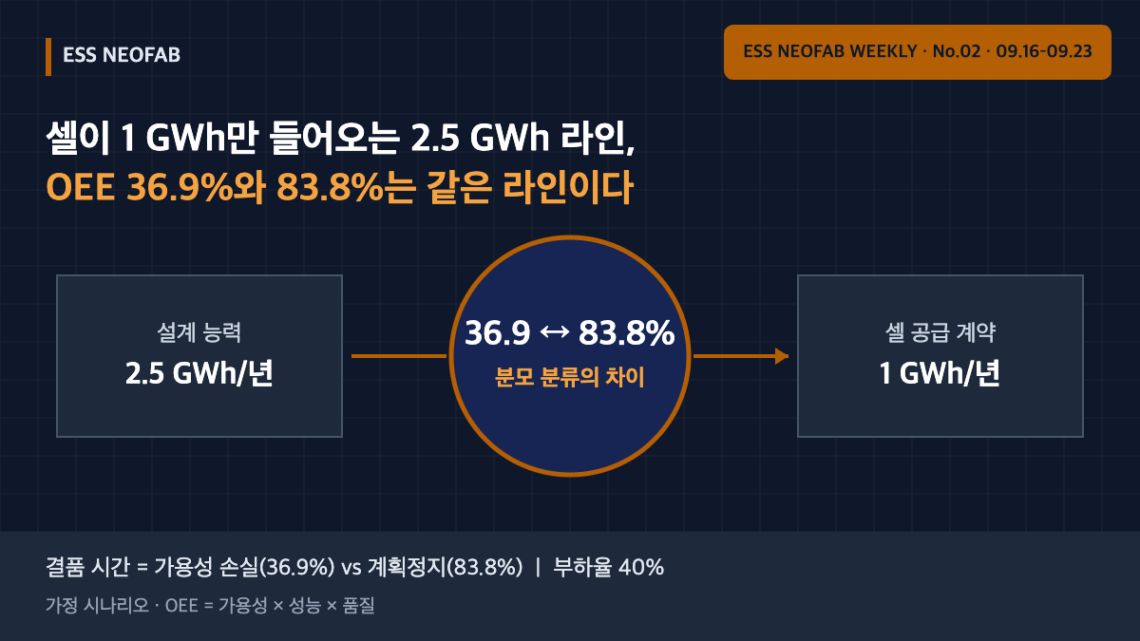
A 2.5 GWh Line Fed Only 1 GWh of Cells — OEE of 36.9% and 83.8% Describe the Same Line
Advait Group’s supply agreement with Hithium for 314 Ah LFP cells (up to 1 GWh over the next year, 18 September 2026) feeds a 2.5 GWh/yr assembly plant with only 40% of its design capacity. Under an assumed scenario, the same line with the same output reports an OEE of 36.9% if cell-shortage time is counted as availability loss, and 83.8% if it is separated as planned downtime and available operating time is matched to supply. The 46.9-point gap comes from the OEE denominator rule, not the equipment; on supply-constrained lines, the loading ratio should be reported alongside OEE.
You May Also Like
Line Changeover Design in the Era of Low-Price ESS Round-3 Bidding — Flexible Assembly Viewed Through Takt Time and OEE
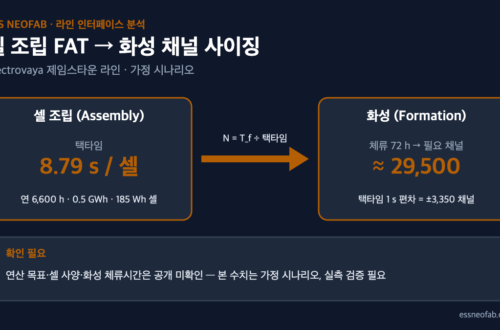
Formation Channel Sizing Read from a Cell Assembly Equipment FAT — How 1 Second of Takt Time Moves 3,350 Channels
Is a Changeover Planned Downtime or an Availability Loss? — How the Definition Changes OEE
-
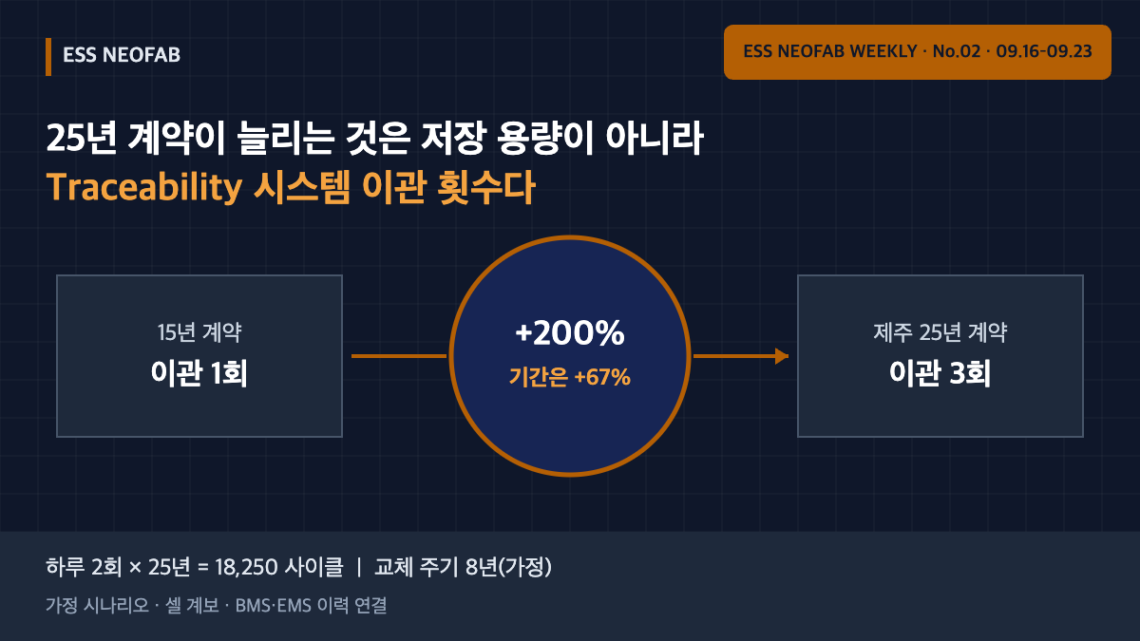
A 25-Year Contract Increases Migrations, Not Storage — Traceability Design for Jeju Long-Term ESS Contracts
Korea’s 2026 ESS central contract market (1,180 MW, opened 22 September 2026) introduced, for the first time, a 25-year contract on Jeju for facilities capable of two charge/discharge cycles per day for 25 years. A longer contract lengthens the retention period for cell-level Traceability records. Under an assumed scenario (8-year system replacement cycle), the contract term grows by 67% but Traceability system migrations triple from one to three, while one generation of cell records is only about 15.9 GB. The design constraint of a 25-year contract is not storage but genealogy breaks at each migration.