Designing the Merge Point in a 10 GWh Pack-Container Integration Line: Synchronizing Two Upstream Lines and Sizing AGV Fleet from the Powertrac × Sunka Lead Order
Abstract
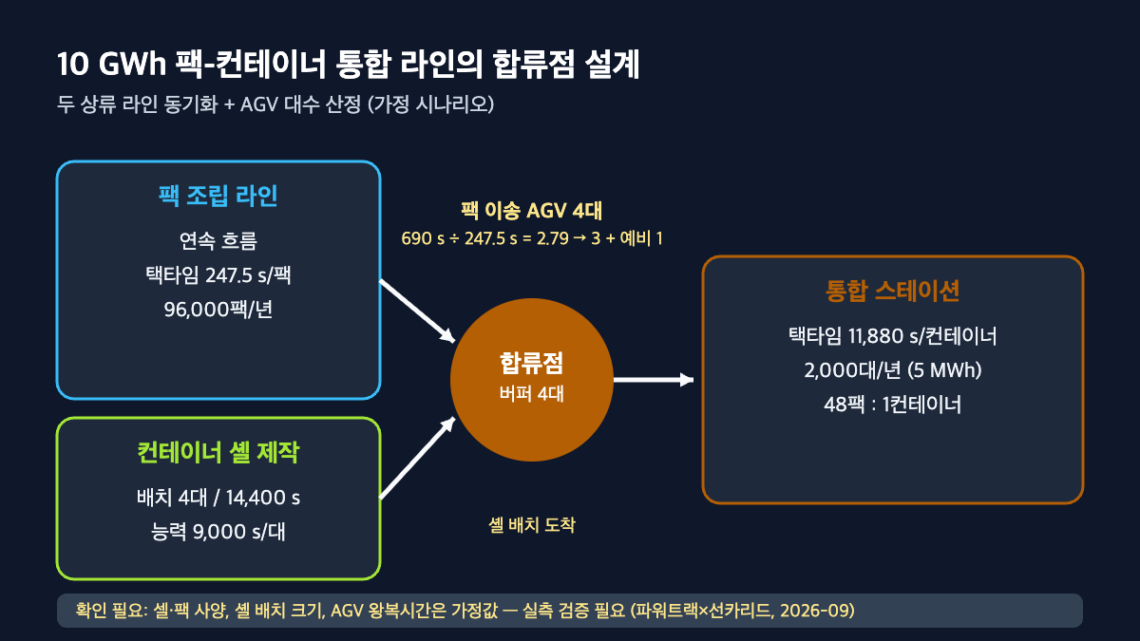
India’s Powertrac has ordered a 10 GWh line from China’s Sunka Lead in which a pack assembly line and an in-house container shell fabrication line — two upstream flows — merge at a single integrated station. In a two-input line of this kind, the first bottleneck appears not at the pack assembly takt time but at the merge point’s synchronization buffer and the AGV transfer capacity linking the two flows.
This article, under an assumed scenario (10 GWh/year, 5 MWh container baseline), back-calculates a container takt time of 11,880 s and a pack takt time of 247.5 s, and derives a design value of a minimum 4-unit merge-point buffer (assuming a shell-fabrication batch size of 4) and a minimum of 4 pack-transfer AGVs (including 1 spare). The approximately 63-day window from equipment arrival (2026, week 3 of November) to production start (2027, week 3 of January) is short for verifying these two interfaces, so empirical verification is required.
1. Conclusion: the line’s first bottleneck is not pack assembly, but the merge point
Conclusion first. In an integrated BESS line where a pack assembly line and a container shell fabrication line meet at a single point, because the two upstream flows run at different rhythms, the merge point’s buffer capacity and transfer-equipment (AGV) count become the primary variable in line balancing[1]. Matching only the pack assembly takt time[2] is not enough — the integrated station will still stall on either shell starvation or pack starvation.
Situation (S): According to pv magazine India (2026-09-08) and ESS News (2026-09-09), Powertrac has ordered a 10 GWh lithium battery pack assembly and pack-container integration line from Sunka Lead for its site in Surendranagar, Gujarat. Prismatic cells are assembled into packs and integrated into containerized BESS ranging from 10 kWh to 5 MWh, with the line including an in-house container fabrication line, AGV-based material handling, robotic assembly, and automated inspection/testing. Equipment arrival is targeted for the third week of November 2026, with production start targeted for the third week of January 2027.
Complication (C): The public material discloses no line speed, pack specifications, shell fabrication method, or AGV count. However, the fact that an “in-house container fabrication line” and “pack-container integration” are bundled into a single order already indicates that this line is not a single flow but a merge of two flows. Shell fabrication includes batch-type processes such as welding, painting, and curing, so its rhythm differs from the pack line’s continuous flow.
Question (Q): How many units’ worth of merge-point buffer are needed to absorb the rhythm difference between the two upstream flows, and how many AGVs are needed to carry packs to the integrated station?
Answer (A): Under the assumed scenario below, a merge-point buffer of 4 shell units and pack-transfer AGVs of 4 units (including spares) are derived as the minimum values. These values scale roughly 1:1 with the shell batch size and AGV round-trip time respectively, so measuring these two variables empirically is a precondition for line design.
2. Background: converting 10 GWh into unit counts and takt times
Takt time = available operating time ÷ customer required quantity is applied as the fixed definition. Available operating time is assumed at 300 days/year × 2 shifts × 22 h = 23,760,000 s. The reference product is set at the maximum specification within the order’s stated range, a 5 MWh container, with cells assumed at 314 Ah × 3.2 V (≈1,004.8 Wh), packs at 104 cells (≈104.5 kWh), and containers at 48 packs (≈5,016 kWh). All values are assumed scenarios; actual specifications require verification.
| Level | Annual quantity (assumed) | Takt time (s) | Notes |
|---|---|---|---|
| Container (5 MWh) | 2,000 units | 11,880 | Integrated-station reference rhythm |
| Pack (104.5 kWh) | 96,000 units | 247.5 | Pack assembly line exit rhythm |
| Cell (1,004.8 Wh) | 9,984,000 units | 2.38 | Cell inbound rhythm |
| Container shell (in-house) | 2,000 units | 11,880 (demand) / 9,000 (capacity, assumed) | 32% margin; includes batch processes |
The comparison baseline is the container takt time of 11,880 s. The pack line must output 48 packs in the same period, so one pack must exit every 247.5 s. The direct implication is that this ratio of rhythms (48:1) is what determines the inventory structure at the merge point. Measurement condition note: quantities are based on rated energy; yield and rework are not reflected.
Demand context is also worth noting. According to pv magazine India (2026-09-07), India’s CEA has proposed mandating co-located ESS and grid-forming inverters for new ground-mounted solar and onshore wind projects. Given that Powertrac itself holds 480 MW of IPP capacity (under signed PPAs), part of this line’s initial demand may be filled by its own projects — though this is a separate matter requiring verification rather than an inference drawn from the public material.
3. Mechanism: back-calculating merge-point buffer size and AGV count
3-1. The rhythm difference between the two upstream flows
The pack line is a continuous flow with a 247.5 s cycle. The shell fabrication line, by contrast, is assumed to batch-process painting and curing after welding (batch size 4, curing dwell time 14,400 s), so shells arrive in bundles of 4 every 14,400 s. Although average capacity (9,000 s/unit) has a 32% margin over demand (11,880 s/unit), because arrivals are lumped, the integrated station is exposed to the batch interval rather than the average.
The minimum capacity of the merge-point buffer[3] is set as (batch size − 1) plus 1 unit of safety stock. Assuming a batch size of 4, this gives 3 + 1 = 4 units’ worth of shell waiting area. Since a 5 MWh-class container shell is approximately 6,058 mm long (20 ft class, assumed), the area for 4 units and the heavy-load transfer path to the integrated station (crane or rail) must be fixed early in layout design.
3-2. AGV count = round-trip time ÷ takt time
Assume packs (approximately 104.5 kWh; weight requires verification) are carried by AGV from the pack line exit to the integrated station. Setting one AGV round-trip cycle at 60 s loading + 200 s one-way travel (200 m) × 2 + 60 s unloading = 520 s, and adding a 33% charging/standby margin gives an assumed 690 s. The required count is 690 ÷ 247.5 = 2.79 → 3 units, plus 1 spare for charging rotation, giving a minimum of 4 units.
| Variable | Baseline (assumed) | Change | Required AGVs (including spare) |
|---|---|---|---|
| Pack takt time | 247.5 s | Increase to 12 GWh/year → 198 s | 3.48 → 4 + 1 = 5 units |
| AGV round-trip time | 690 s | Extend route to 300 m → 890 s | 3.60 → 4 + 1 = 5 units |
| Baseline | — | — | 2.79 → 3 + 1 = 4 units |
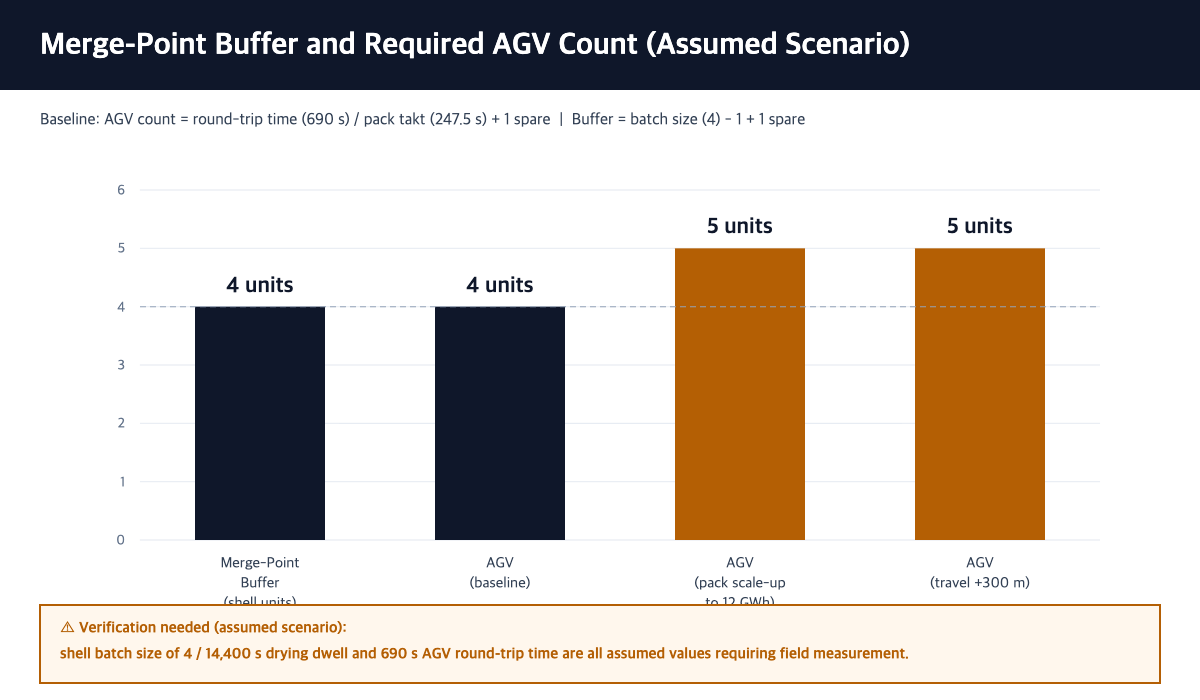
The comparison baseline is 4 units. A 20% reduction in takt time and a 100 m extension in travel distance each produce an effect of the same magnitude (1 additional unit), so the direct implication is that route length at the layout stage must be treated as a design variable on par with capacity expansion. Measurement condition note: AGV speed, charging method, and intersection wait time are not reflected; a single-path assumption is used.
3-3. Prior-art reference
General prior art relevant to pack-container integration structures includes Tesla’s US20210159567A1 (Integrated energy storage system, published 2021-05-27, issued as US11962030B2), which describes a frame structure in which packs form a sealed container upon completion of manufacturing assembly or product integration. Containerized BESS configurations are addressed in US10536007B2 (Battery energy storage system and control system and applications thereof), and pack processes that arrange cells in holders/trays for compression assembly are addressed in US20180219205A1. None of the three corresponds 1:1 to the Powertrac/Sunka Lead line; they are cited for conceptual reference only.
4. Industry snapshot
PJM backstop capacity auction. According to Energy-Storage.News (2026-09-08), the U.S. PJM is running a one-time backstop auction from 2026-09-30 to 10-21 to procure approximately 6 GW of new capacity, with an average cost cap of $555/MW-day and 15-year contract terms. With capacity prices having risen more than 1,000% in two years due to data-center demand, BESS is expected to hold a competitive advantage. From a line perspective, 15-year fixed-contract demand is a factor that increases long-term takt-time stability for pack lines.
China’s first-ever decline in first-half installations. Per CNESA data cited by Energy-Storage.News (2026-09-03), China’s new ESS installations in the first half of 2026 fell to 22 GW/59 GWh, a first-ever decline, while overseas orders rose 83%. Powertrac’s ordering of a line from a Chinese equipment maker reads as one instance of this rise in overseas orders; whether equipment supply lead times may be constrained by the Chinese maker’s order backlog requires verification.
5. Implications: two interfaces to verify within a 63-day window
From equipment arrival (week 3 of November) to production start (week 3 of January) is approximately 63 days. Within this window, the priority items to verify are (1) empirical measurement of shell batch size and arrival interval, and (2) empirical measurement of AGV round-trip time. If either value differs from the assumption, buffer area and AGV count change immediately, which entails layout changes — so the range must be narrowed via simulation before equipment arrival. Pilot-scale measured values cannot be equated 1:1 with production-line performance; further verification is required.
This article addresses a different layer from an earlier article that sized channel count at the interface between assembly takt time and formation dwell time, and from another earlier article that addressed cell-inbound traceability load at a pack assembler. Those articles addressed upstream-downstream relationships within a single flow; this article addresses the synchronization problem at the point where two distinct flows merge.
FAQ
Q. If shell fabrication capacity has a 32% margin over demand, why is a buffer needed at all?
A. A margin in average capacity only guarantees that long-term inventory will not accumulate — it does not guarantee instantaneous supply. If painting and curing proceed in batches, shell supply is zero for 14,400 s and then 4 units arrive at once. Because the integrated station’s takt time of 11,880 s is shorter than this interval, without a buffer, at least one cycle’s worth of waiting occurs at every batch. The margin rate sets the ceiling on inventory; the batch size sets the floor on the buffer.
Q. Given the product range spans 10 kWh to 5 MWh, is a takt time based on the 5 MWh reference meaningful?
A. Pack takt time is tied to total energy throughput, so it remains at 247.5 s regardless of product mix. Integration event count, however, is proportional to unit count. For example, if 30% of energy shifts to 500 kWh cabinets, the mix becomes 1,400 containers + 6,000 cabinets = 7,400 units, shortening the integration takt time to 3,211 s. In other words, even for the same 10 GWh, a mix skewed toward smaller units increases the merge-point and integrated-station load by more than 3x — so the 5 MWh reference value should be read as a floor, not a ceiling.
Field Application Notes
| Item | Monday-morning action | Deliverable | Verification needed |
|---|---|---|---|
| Measure shell batches | Record batch size and arrival interval for painting/curing over the most recent 20 batches | Batch-size distribution, maximum interval (s) | Batch size of 4 / 14,400 s is an assumed value |
| Merge-point buffer area | Mark the buffer area on the layout as (maximum batch size − 1) + 1 spare unit of shell waiting space | Number of buffer units, area (drawing in mm) | 6,058 mm shell dimension assumes 20 ft class |
| Measure AGV round trips | Stopwatch-measure 10 round trips from pack-line exit to integrated station | Average/maximum round-trip time (s) | 690 s is an assumed value; intersection wait not reflected |
| Recalculate AGV count | Measured round-trip time ÷ pack takt time → round up + 1 spare | Required AGV count | Spare count varies with charging method (swap vs. fast-charge) |
| Mix sensitivity | Recalculate integration takt time using annual product mix by unit count | Integrated-station count | Actual order mix requires verification |
Footnotes
[1] Line balancing: The design activity of equalizing workload across each process in a line to match takt time. In this article, used in the broad sense that includes merge-point buffer and transfer capacity.
[2] Takt time: Available operating time ÷ customer required quantity. Distinguished from cycle time (the actual time to process one unit). OEE (Overall Equipment Effectiveness) is defined as availability × performance × quality and is not directly calculated in this article.
[3] Merge-point buffer: The inventory space placed immediately before the merge point to absorb the rhythm difference when two upstream flows of differing rhythm converge into a single downstream station.
References
pv magazine India, “Powertrac orders 10 GWh BESS manufacturing line from SUNKA LEAD” (2026-09-08) · ESS News, “India’s Powertrac orders 10 GWh BESS production line from Sunka Lead” (2026-09-09) · Electrical Mirror, “Powertrac Orders 10 GWh AI-Driven, AGV and Robotic BESS Manufacturing Line in Gujarat” (2026-09-07) · pv magazine India, “India’s CEA proposes mandatory co-located storage for new solar, wind projects” (2026-09-07) · Energy-Storage.News, “PJM targets data centre demand with 6GW backstop auction” (2026-09-08) · Energy-Storage.News, “China’s half-year energy storage deployments post first-ever decline to 22GW/59GWh” (2026-09-03) · Google Patents US20210159567A1, US10536007B2, US20180219205A1.
Related Reading
- Formation Channel Sizing Read from a Cell Assembly Equipment FAT — How 1 Second of Takt Time Moves 3,350 Channels
- Sebang Lithium Battery’s Simultaneous HEV Pack and ESS Module Orders — Analyzing the Cell-Inbound Interface and Cell-ID Traceability Load
- Inter-Process Buffers: Bigger Isn’t Always Better


You May Also Like
Long-Duration ESS Interface Design in the Era of Power-Grid Saturation
Between the Continuous Solid-Electrolyte Process and the Assembly Line: How Should the Buffer Interface Be Designed?
One Comment
Pingback: