Process
This category analyzes the systemic impact of upstream process outcomes on downstream processes, going beyond the performance of individual unit equipment.
-
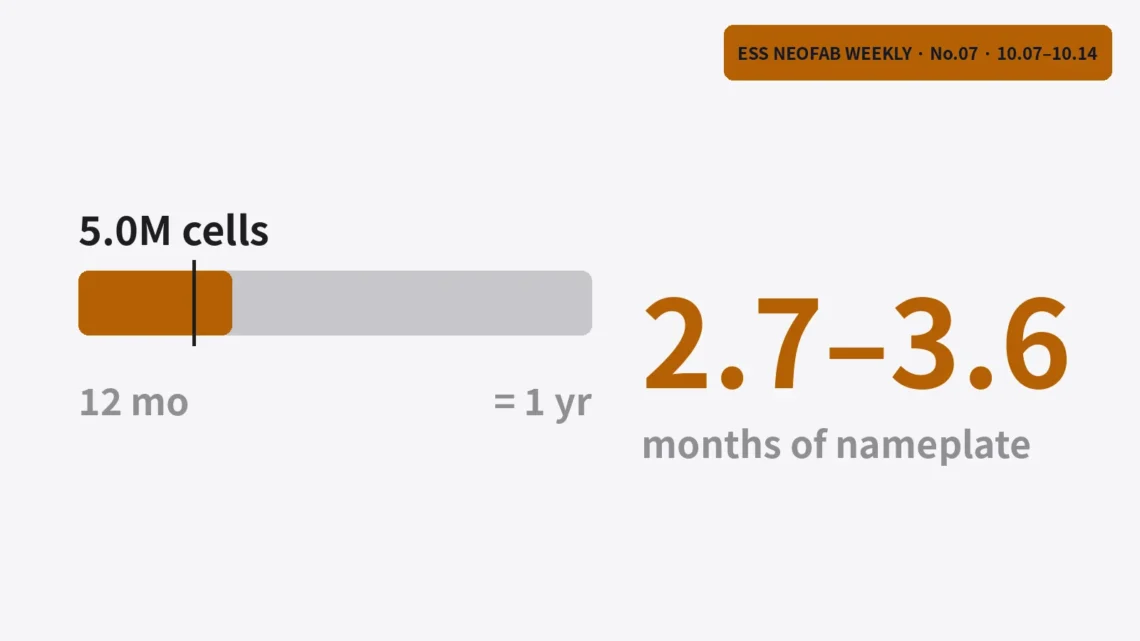
Five million ACC cells equal 2.7 to 3.6 months of nameplate output
ACC's Douvrin plant in France announced a running total of five million cells on 12 October 2026. Two figures in the coverage imply about 125 cells per vehicle, and assuming the first block runs at 13 GWh a year, five million cells equal 22.5 to 29.9 % of one nameplate year, or 2.7 to 3.6 months. Reports do not say how many years the total took, so average utilization can only be given as a range: 11.2 to 14.9 % over two years, 5.6 to 7.5 % over four. Applying the 15 to 20 % scrap rate reported in November 2025 would put 0.88 to 1.25 million scrapped cells behind…
-
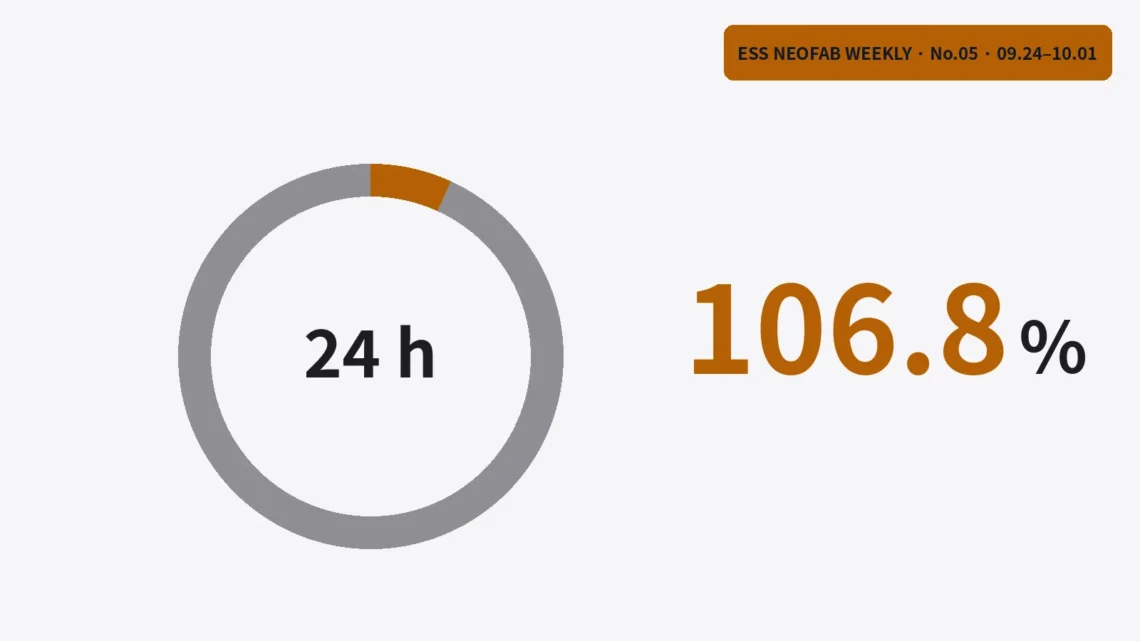
Two Cycles a Day Take 106.8 % of a Day, and the Retention Tier Shifts Cell Volume by 1.47 GWh
Korea's 25-year Jeju contract asks for at least 730 charge and discharge cycles a year from an 80 MW, 480 MWh system that runs for 21,600 s (6 hours) at full power. If each cycle is a full one and round-trip efficiency is assumed at 0.88, two cycles a day take 92,291 s, which is 106.8 % of the 86,400 s in a day. The warranty-life score pays 7 points for 90 % or more capacity at contract end and 1.75 points for 75 to 80 %. With no cells allowed to be added mid-term, the mainland's 6.6 GWh needs between 7.33 and 8.80 GWh of installed cells, a gap…
-
Battwoo’s Second-Life EV Batteries — When an 80 % Acceptance Threshold Overlaps the Retirement Distribution, Incoming Screening Becomes the Bottleneck
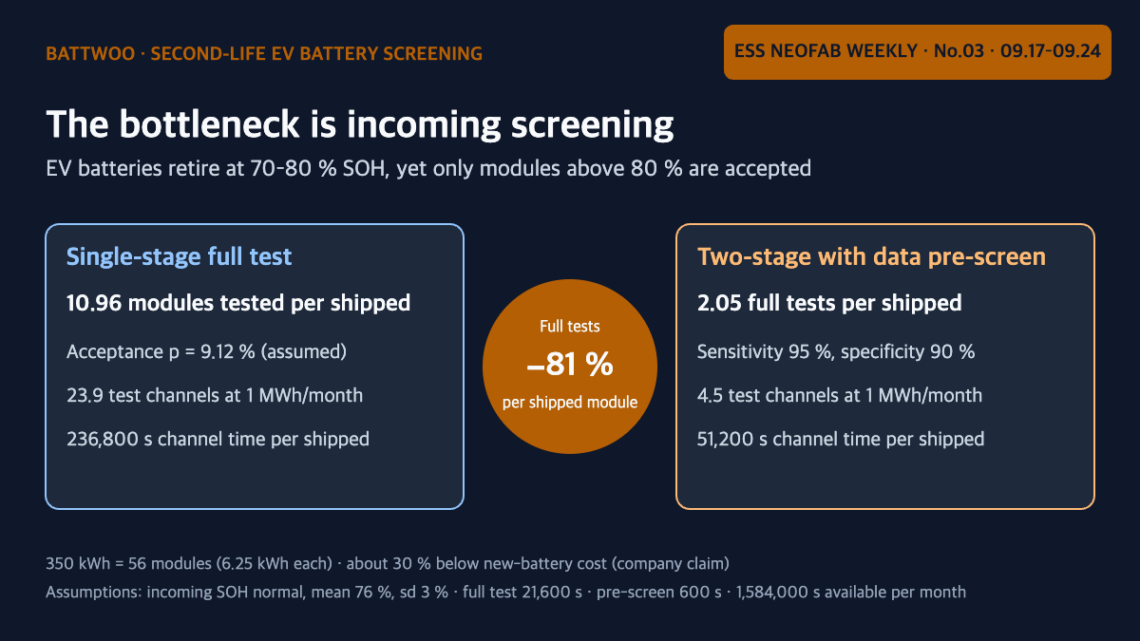
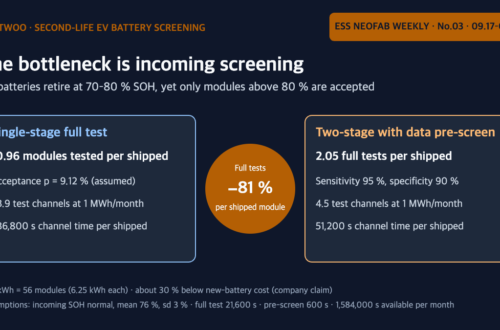
French startup Battwoo refurbishes into stationary ESS only those retired EV batteries that retain more than 80 % of their capacity, while EV batteries typically retire at 70–80 %, and it says a 500 kWh system costs about 30 % less than one built with new batteries¹. When the retirement distribution and the acceptance threshold overlap like this, the acceptance rate is low: assuming incoming SOH with a mean of 76 % and a standard deviation of 3 %, the acceptance rate is 9.1 %, so 11.0 modules must be tested for every module shipped. At an assumed 1 MWh per month of shipments, 23.9 full-capacity test channels are needed,…
You May Also Like
The Equipment Maker’s Line-Ownership Shift — OEE and Takt-Time Design During the ESS-LFP New-Line Mass-Production Ramp-Up
The Interface Between Laser Notching Cycle Time and Line Takt Time — The Head-Count Sizing Problem Revealed by DI ENT’s Ohio Supply Contract

45 Days from Pohang to Georgia — Safety Stock at an Intercontinental Cathode Interface Is Driven by Lead-Time Variability, Not Demand
-
US storage set an energy record in Q2 as installed power fell 7%
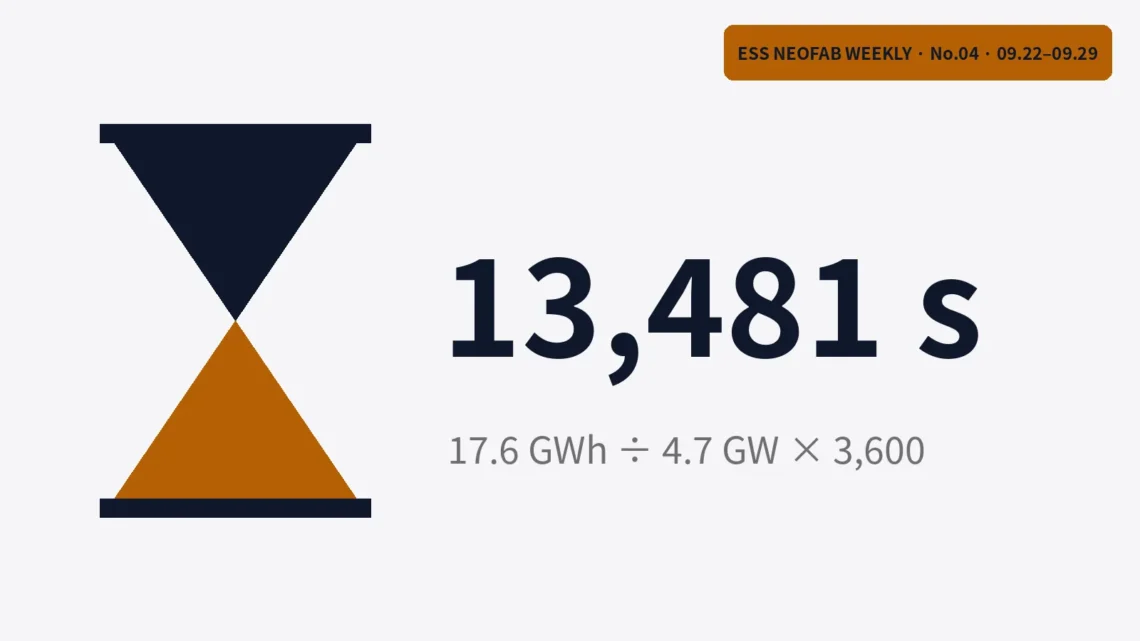
The US installed a record 18.9 GWh of energy storage in the second quarter of 2026, yet installed power fell 7% from a year earlier. Duration, the energy divided by the power, got longer, and for utility-scale projects it reached 13,481 s (about 3.74 hours). If duration stretches to the 14,788 s average in the 2026–2031 outlook, a 10% rise in energy calls for only 0.3% more PCS capacity. Battery lines follow GWh and PCS-transformer lines follow GW, and each conversion unit carries a larger share as duration grows.
You May Also Like

Grid-Forming PCS Mandate Redesigns FAT Takt Time and the BMS-PCS-EMS Interface
Don’t Subtract Breakdowns When Calculating Takt Time — Takt Time vs. Cycle Time vs. Lead Time
The Equipment Maker’s Line-Ownership Shift — OEE and Takt-Time Design During the ESS-LFP New-Line Mass-Production Ramp-Up
-
CATL Starts Trial Production in Debrecen — The Digits of the Defect-Rate Target, Not the Equipment, Set the Length of a Trial Run
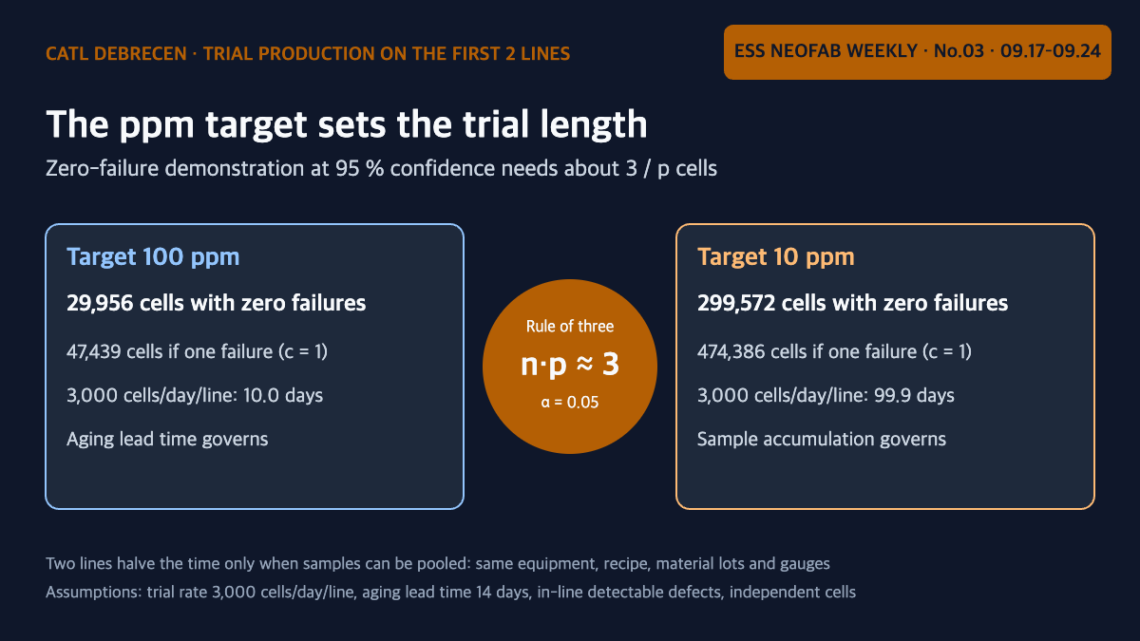
On September 22, 2026, CATL started trial production on the first two production lines of its cell plant in Debrecen, Hungary, stating that the purpose is "to set up, optimise and validate the production equipment and manufacturing processes ahead of series production"¹. If validation is defined as demonstrating a defect rate, a zero-failure demonstration at 95 % confidence requires 29,956 cells for 100 ppm and 299,572 cells for 10 ppm. Compared with an assumed aging-judgment lead time of 14 days, aging governs the trial length at a 100 ppm target, while sample accumulation governs it at 10 ppm. The second line halves the time only when samples are pooled, and…
You May Also Like
Battwoo’s Second-Life EV Batteries — When an 80 % Acceptance Threshold Overlaps the Retirement Distribution, Incoming Screening Becomes the Bottleneck
Don’t Subtract Breakdowns When Calculating Takt Time — Takt Time vs. Cycle Time vs. Lead Time

Even a tenfold faster model moves the whole by 1.29x — what “5 to 10 times faster commissioning” actually requires
-
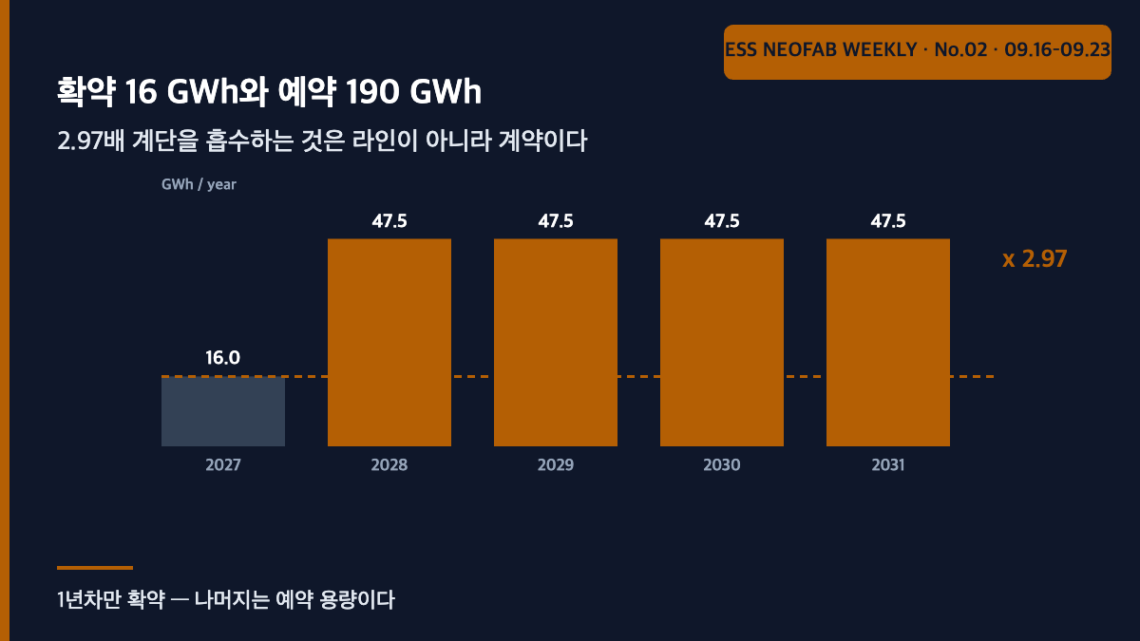
16 GWh committed and 190 GWh reserved — what absorbs the 2.97x step is the contract, not the line
The EVE Energy - Fluence framework of up to 206 GWh for 2027-2031 turns on how it is split: only 16 GWh for 2027 is committed, the remaining 190 GWh is reserved capacity. At an assumed 6 GWh/yr per line that is a 2.97x step from three lines to eight - five more within a year - yet backing out an 18-month lead time shows the step was already 2.6 months late at disclosure. What absorbs the step is the contract wording, not the line.
You May Also Like

Embedding an AI Vision Inspection Gate in the Line: Redefining OEE and Takt-Time Design Variables
Electrode Roll Genealogy: How Key Reissue at Slitting and Stacking Shrinks Defect Isolation from 1,500 Cells to 2
The Interface Between Laser Notching Cycle Time and Line Takt Time — The Head-Count Sizing Problem Revealed by DI ENT’s Ohio Supply Contract
-
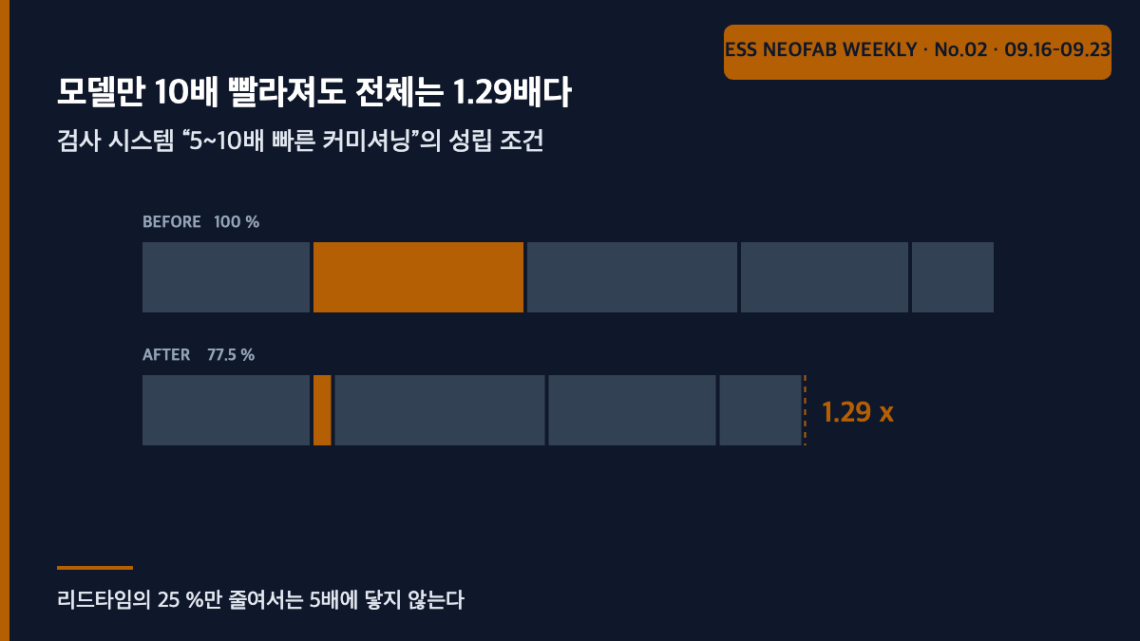
Even a tenfold faster model moves the whole by 1.29x — what “5 to 10 times faster commissioning” actually requires
Siemens and P&G announced on 18 September 2026 that their VIC inspection platform commissions new deployments 5-10x faster. Re-read through Amdahl's law, accelerating the model stage (assumed 25 % share) tenfold shortens the whole by only 1.29x (22.5 %). For 5x to hold the accelerated scope must exceed 88.9 %, and 10x at a partial factor of 5 is arithmetically impossible. The bottleneck is not AI but the standardisation of lighting, mechanics, integration and handover.
You May Also Like

StarPlus Energy’s Indiana Plant — The Blended-OEE Illusion Created by Sequential NCA/LFP Commissioning
Pylontech’s 588 Ah and 601 Ah LFP Cells Enter Mass Production — Why Energy-Weighted Availability Stays the Same When the Cell Count Halves
LFP High-Compaction-Density Conversion and the Calendering Interface: How Nip Pressure and Line Speed Affect Takt Time
-
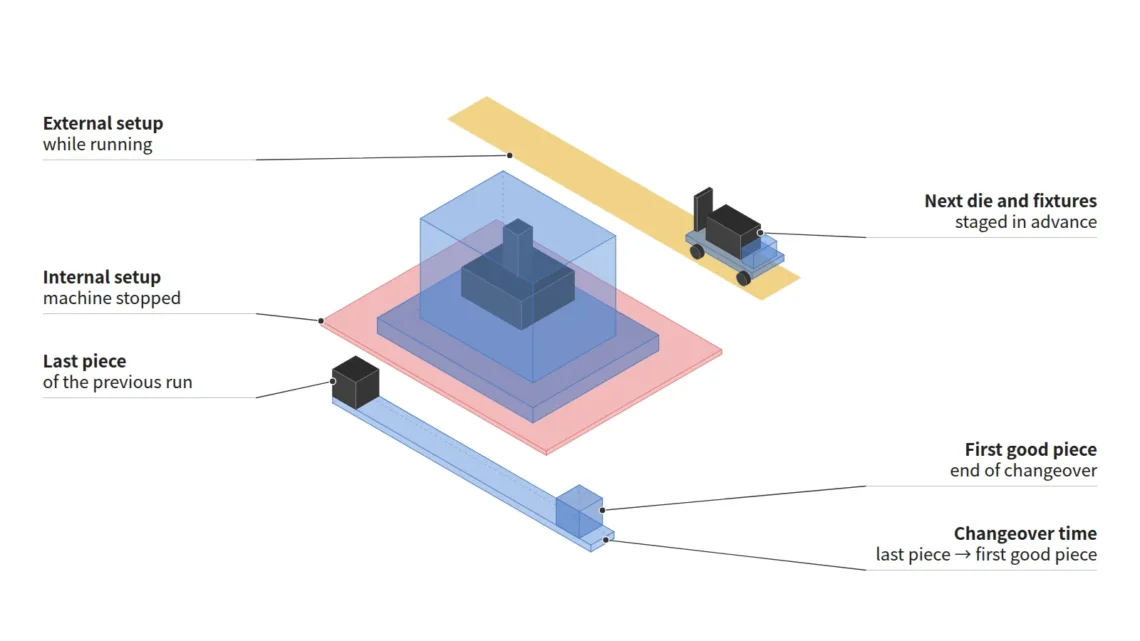
Is a Changeover Planned Downtime or an Availability Loss? — How the Definition Changes OEE
Whether a changeover (also called a setup) counts as planned downtime or as an availability loss differs from source to source, and because that choice alone changes availability and OEE substantially, changeover time must be tracked as a metric separate from OEE. The "Downtime" entry in the Lean Enterprise Institute (LEI) lexicon classifies changeovers to produce other products as planned downtime, while the Japan Institute of Plant Maintenance (JIPM) classifies setup and adjustment as a stop loss in availability. In an assumed shift (loading time 27,600 s, changeovers 3,000 s, breakdowns 600 s), availability is 87.0 % under the JIPM approach and 97.6 % under a planned-downtime approach that subtracts…
You May Also Like
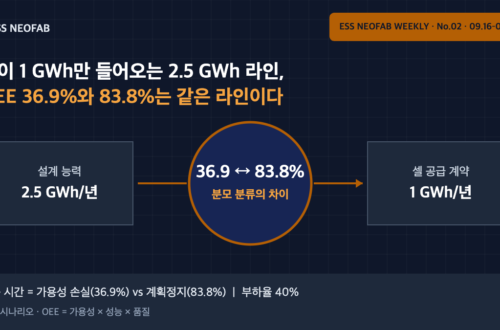
A 2.5 GWh Line Fed Only 1 GWh of Cells — OEE of 36.9% and 83.8% Describe the Same Line
Even a tenfold faster model moves the whole by 1.29x — what “5 to 10 times faster commissioning” actually requires

Edge AI Vision Inspection and Battery-Pack Leak Testing: How Gateway Aggregation Affects Traceability Completeness
-
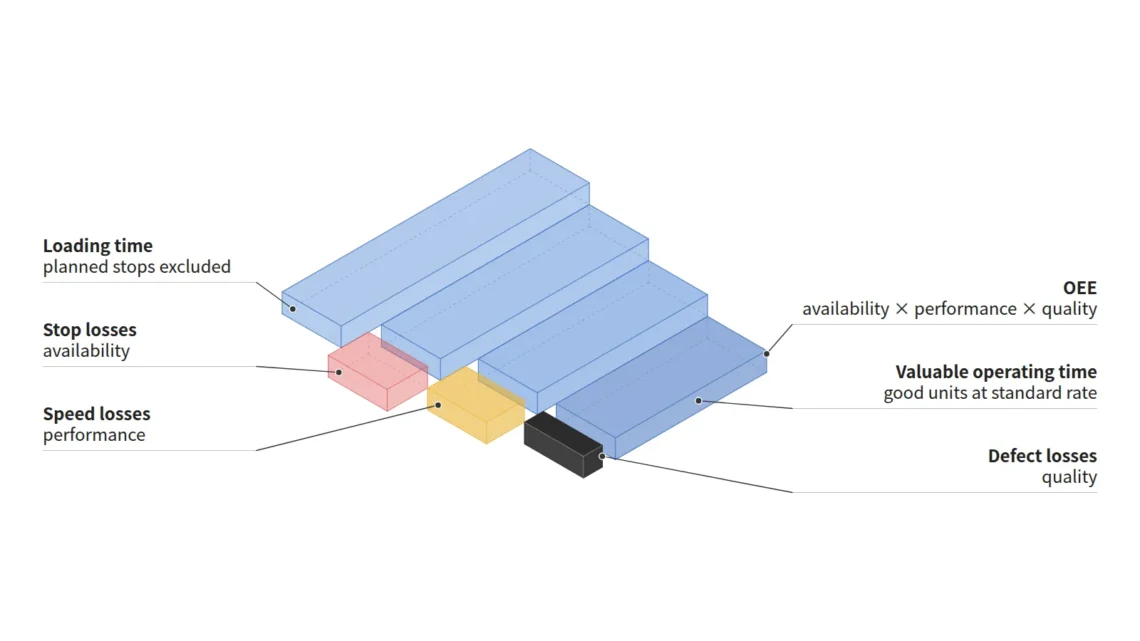
If Availability, Performance and Quality Are All 80 %, OEE Is 51.2 % — How to Calculate OEE
OEE (overall equipment effectiveness) is calculated as availability × performance × quality, and the Japan Institute of Plant Maintenance (JIPM) gives the example that when all three factors are 80 %, OEE is 51.2 %. When the three factors are multiplied as JIPM defines them, OEE is organized as "standard (planned) cycle time × number of good units ÷ loading time," that is, the share of loading time spent making good units at the standard speed. In an assumed shift (loading time 27,600 s, standard cycle time 32 s, 690 good units), availability is 90.0 %, performance 90.4 % and quality 98.3 %, giving an OEE of 80.0 %. If…
You May Also Like
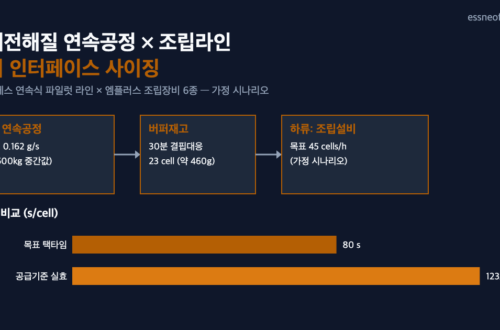
Between the Continuous Solid-Electrolyte Process and the Assembly Line: How Should the Buffer Interface Be Designed?
Edge AI Vision Inspection and Battery-Pack Leak Testing: How Gateway Aggregation Affects Traceability Completeness
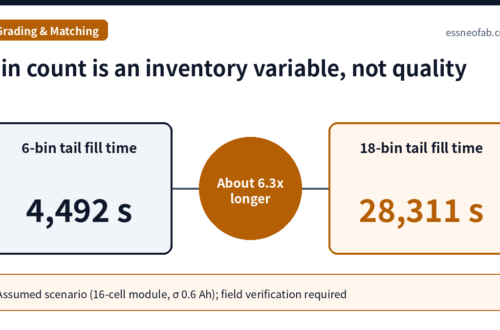
Cell Grading Bin Count and Grade-Specific WIP: What Module Matching History Must Retain
-
Don’t Subtract Breakdowns When Calculating Takt Time — Takt Time vs. Cycle Time vs. Lead Time
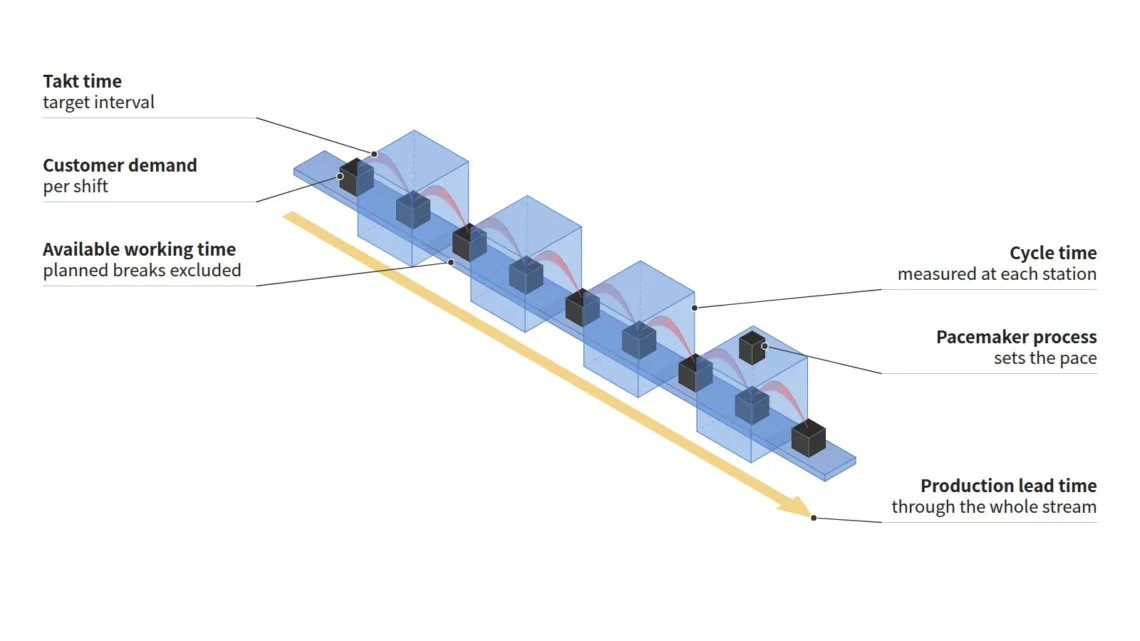
Takt time is the target production interval obtained by dividing available working time by customer demand, whereas cycle time is the measured time a process actually takes to make one unit. The calculation rule in the workbook published by the Lean Enterprise Institute (LEI) subtracts from shift time planned operator breaks, meetings, cleanups, etc., but not time for unplanned machine downtime, changeovers or other internal problems. Dividing the 27,600 s of available working time per shift obtained under this rule by the demand per shift of 690 units gives a takt time of 40 s. To cover stopped time as well, the measured cycle time must be shorter than takt…
You May Also Like
LFP High-Compaction-Density Conversion and the Calendering Interface: How Nip Pressure and Line Speed Affect Takt Time
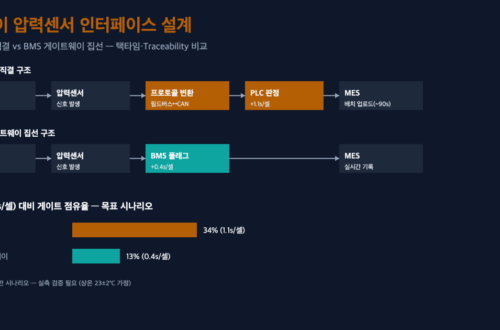
46-Phi Cylindrical Cell Line Conversion: The Pressure-Sensor–BMS Interface Determines Takt Time
Between the Continuous Solid-Electrolyte Process and the Assembly Line: How Should the Buffer Interface Be Designed?