Process
This category analyzes the systemic impact of upstream process outcomes on downstream processes, going beyond the performance of individual unit equipment.
-
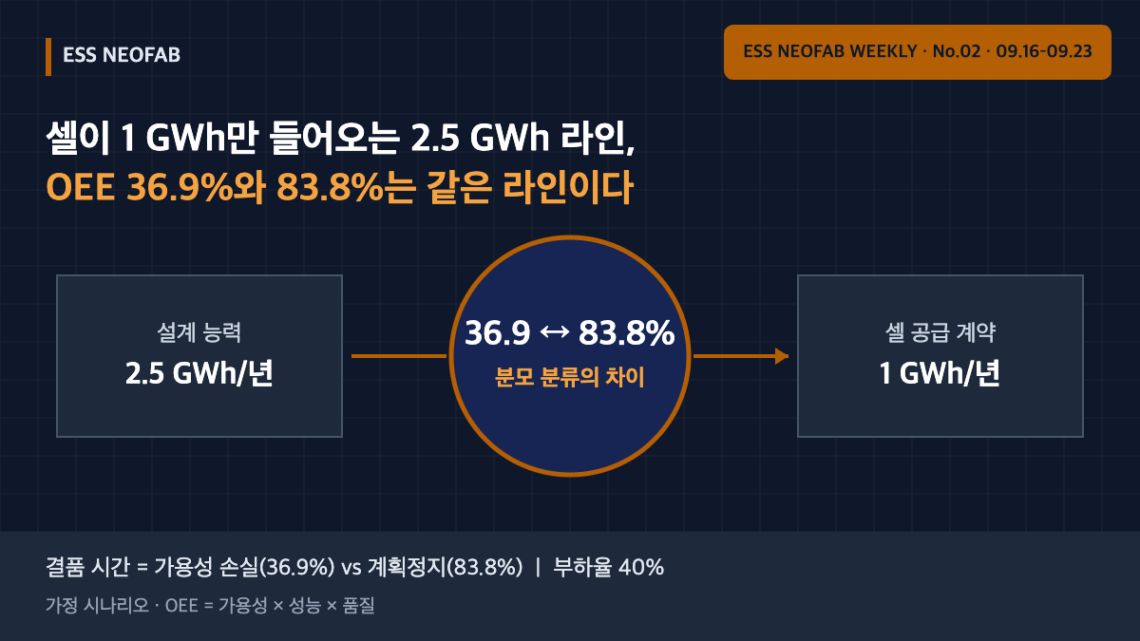
A 2.5 GWh Line Fed Only 1 GWh of Cells — OEE of 36.9% and 83.8% Describe the Same Line
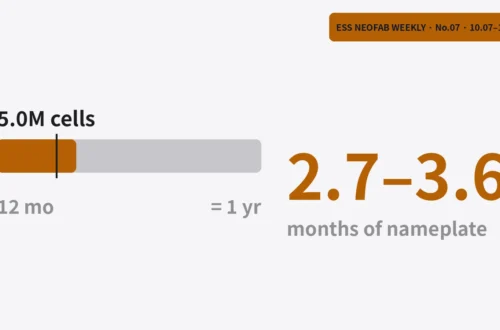
Advait Group’s supply agreement with Hithium for 314 Ah LFP cells (up to 1 GWh over the next year, 18 September 2026) feeds a 2.5 GWh/yr assembly plant with only 40% of its design capacity. Under an assumed scenario, the same line with the same output reports an OEE of 36.9% if cell-shortage time is counted as availability loss, and 83.8% if it is separated as planned downtime and available operating time is matched to supply. The 46.9-point gap comes from the OEE denominator rule, not the equipment; on supply-constrained lines, the loading ratio should be reported alongside OEE.
You May Also Like
Two Cycles a Day Take 106.8 % of a Day, and the Retention Tier Shifts Cell Volume by 1.47 GWh
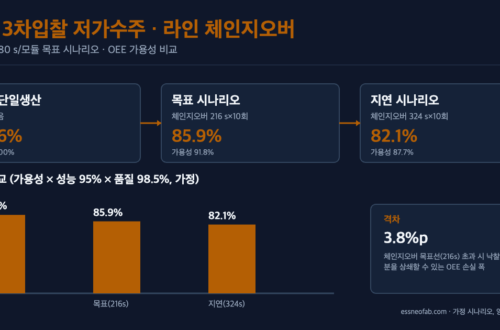
Line Changeover Design in the Era of Low-Price ESS Round-3 Bidding — Flexible Assembly Viewed Through Takt Time and OEE
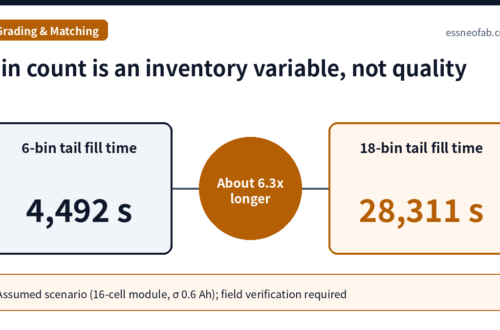
Cell Grading Bin Count and Grade-Specific WIP: What Module Matching History Must Retain
-
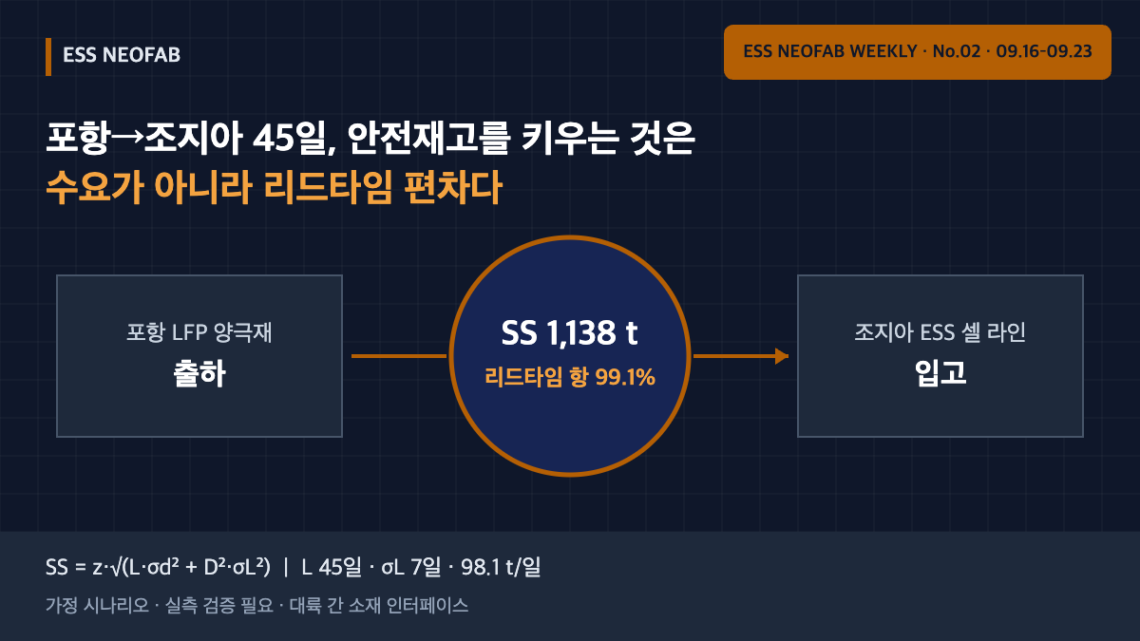
45 Days from Pohang to Georgia — Safety Stock at an Intercontinental Cathode Interface Is Driven by Lead-Time Variability, Not Demand
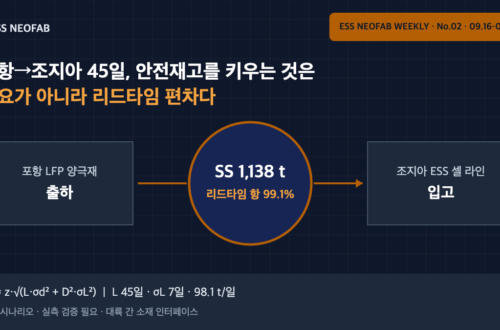
SK On’s roughly KRW 1.0742 trillion LFP cathode contract with POSCO Future M (2027–2029, for its Georgia ESS cell line) puts a continent and an ocean crossing between the materials and cell plants. Under an assumed scenario (45-day lead time, σL 7 days, 98.1 t/day), safety stock in front of the Georgia cell line is about 1,138 t, 99.1% of which comes from the lead-time variability term. Halving lead-time variability cuts it to 577 t; halving demand variability leaves it at 1,136 t. At an intercontinental interface, the management variable is the spread of arrival times, not the demand forecast.
You May Also Like
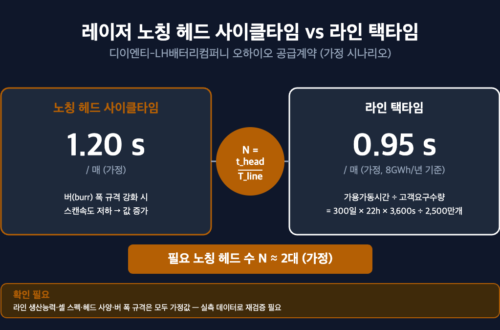
The Interface Between Laser Notching Cycle Time and Line Takt Time — The Head-Count Sizing Problem Revealed by DI ENT’s Ohio Supply Contract
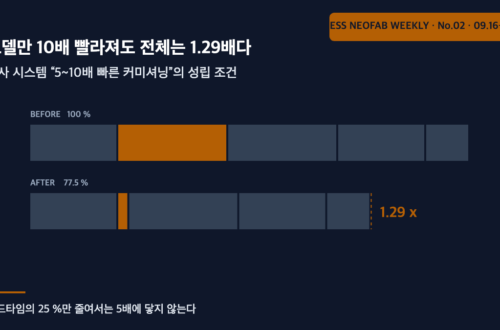
Even a tenfold faster model moves the whole by 1.29x — what “5 to 10 times faster commissioning” actually requires
Formation Channel Sizing Read from a Cell Assembly Equipment FAT — How 1 Second of Takt Time Moves 3,350 Channels
-
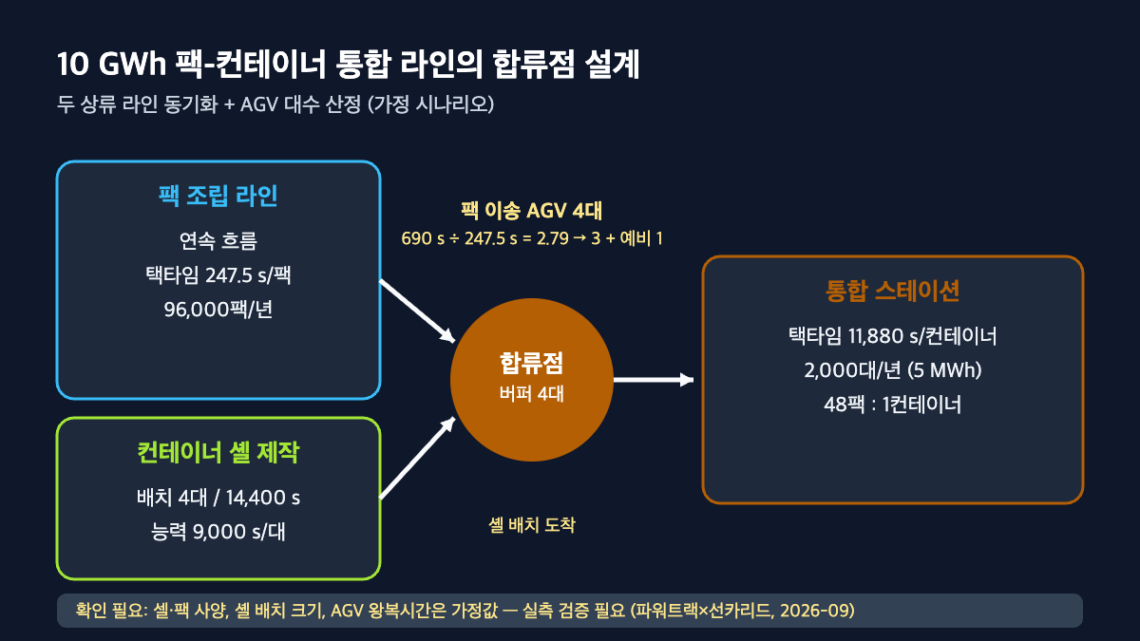
Designing the Merge Point in a 10 GWh Pack-Container Integration Line: Synchronizing Two Upstream Lines and Sizing AGV Fleet from the Powertrac × Sunka Lead Order
India's Powertrac has ordered a 10 GWh line from China's Sunka Lead in which a pack assembly line and an in-house container shell fabrication line — two upstream flows — merge at a single integrated station. In a two-input line of this kind, the first bottleneck appears not at the pack assembly takt time but at the merge point's synchronization buffer and the AGV transfer capacity linking the two flows. This article, under an assumed scenario (10 GWh/year, 5 MWh container baseline), back-calculates a container takt time of 11,880 s and a pack takt time of 247.5 s, and derives a design value of a minimum 4-unit merge-point buffer (assuming…
-
The Interface Between Laser Notching Cycle Time and Line Takt Time — The Head-Count Sizing Problem Revealed by DI ENT’s Ohio Supply Contract
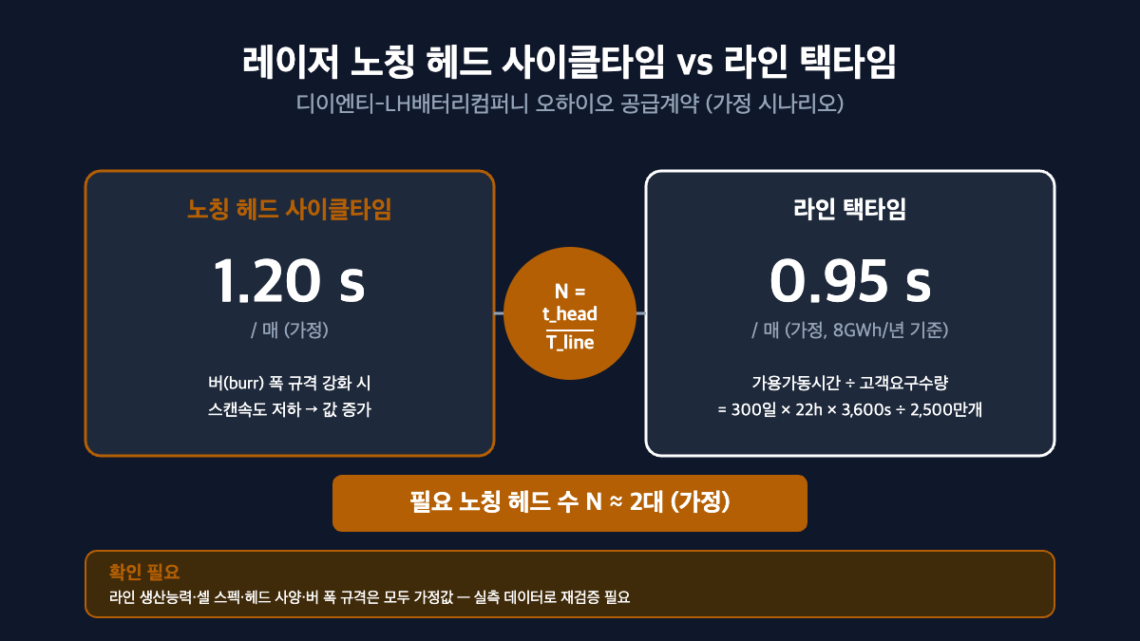
DI ENT signed laser notching equipment supply contracts worth a combined KRW 87.3 billion, across two separate orders, with LH Battery Company (an LG Energy Solution–Honda joint venture), for delivery to Honda’s new second battery plant in Ohio, USA, by March 2026. This supply contract is more than an order-win announcement — it surfaces an interface-design problem between the notching process’s cycle time and the line’s takt time. When the processing time of a single notching head is longer than the takt time the line requires, adding parallel heads becomes unavoidable, and as burr-width specifications are tightened, per-head processing time increases, causing the required head count to rise non-linearly. This…
-
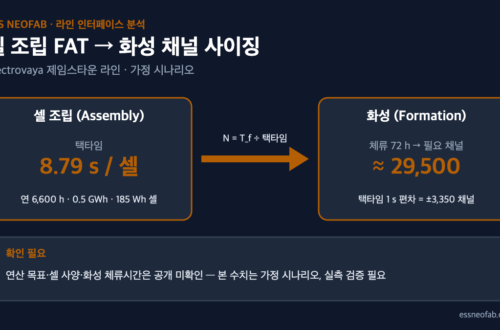
Formation Channel Sizing Read from a Cell Assembly Equipment FAT — How 1 Second of Takt Time Moves 3,350 Channels
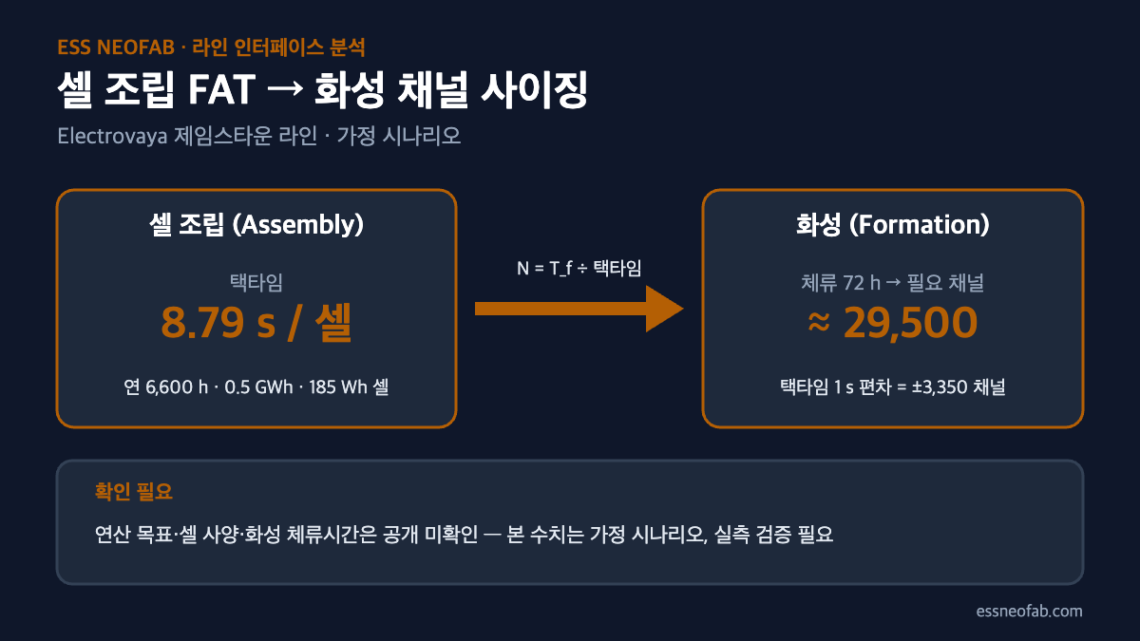
Electrovaya announced that on August 24, 2026, it began a Factory Acceptance Test (FAT) of automated cell-assembly and Formation equipment for its Jamestown, New York cell plant, to be followed after completion in early October by shipping and a Site Acceptance Test (SAT). This article reinterprets that FAT not as “equipment inspection” but as a sizing verification that absorbs, through the number of Formation channels, the takt-time mismatch between cell assembly — which moves at a second-by-second cadence — and Formation — which holds cells for hours at a time. Under an assumed scenario (0.5 GWh annual output, 185 Wh cells, 6,600 h/yr of operation, 72 h Formation dwell time),…
You May Also Like
45 Days from Pohang to Georgia — Safety Stock at an Intercontinental Cathode Interface Is Driven by Lead-Time Variability, Not Demand
Why three qualified products landed on the same duration — in DSX Ready BESS, sizing is set by the output axis
Even a tenfold faster model moves the whole by 1.29x — what “5 to 10 times faster commissioning” actually requires
-
Introducing Robotic Automation Equipment — Where Does the Interface with Line Takt Time Break Down
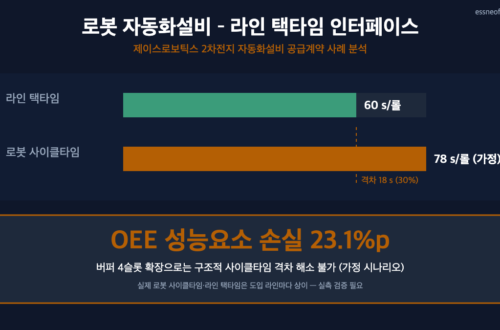
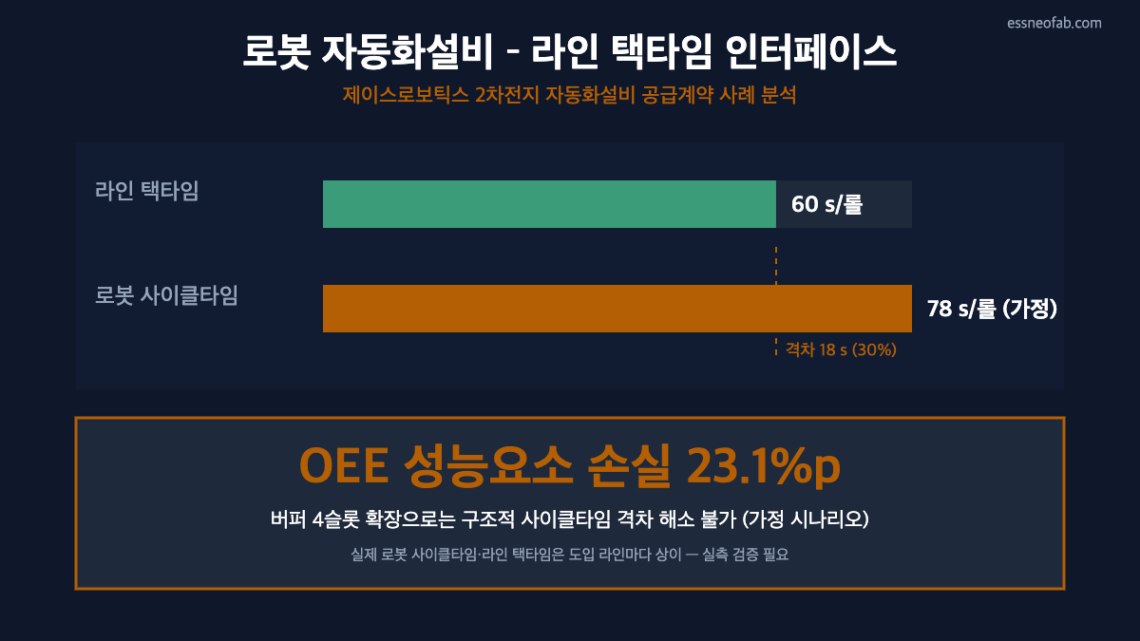
The supply contract disclosed by JS Robotics on September 2, 2026, worth roughly KRW 33.26 billion, for battery-manufacturing robotic automation equipment brings renewed attention to the Cycle Time-Takt Time gap that arises the moment new robotic equipment is connected to an existing R2R (Roll-to-Roll) line. This article calculates an assumed scenario in which one cycle of robotic automation equipment exceeds the line takt time, distinguishing the range of variation that buffer accumulation design can absorb from the structural gap it cannot. The analysis concludes that buffers absorb only micro-stop-level variation, and that a structural gap where the robot's own cycle time exceeds takt time translates directly into OEE performance-factor loss,…
-
LFP High-Compaction-Density Conversion and the Calendering Interface: How Nip Pressure and Line Speed Affect Takt Time
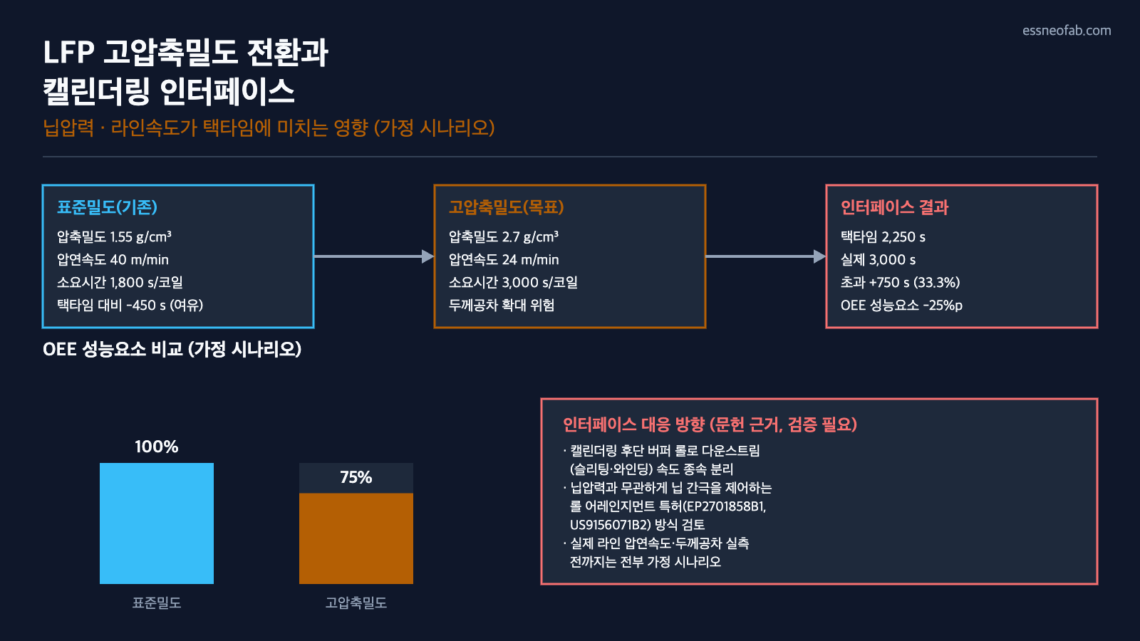
If the compaction density target for LFP (Lithium Iron Phosphate) cathode material — typically in the 1.4–1.6 g/cm³ range — is raised to the 2.7 g/cm³ class that L&F has disclosed as its end-2026 mass-production target, the nip pressure and line speed of the calendering (rolling) process must be redesigned, and this directly affects the takt time and OEE (Overall Equipment Effectiveness) performance factor of existing operating lines. In an assumed-scenario calculation, if the rolling speed decelerates from 40 m/min to 24 m/min, the calendering time per coil (1,200 m) increases from 1,800 s to 3,000 s, creating a bottleneck that exceeds the 2,250 s takt time by 750 s…
-
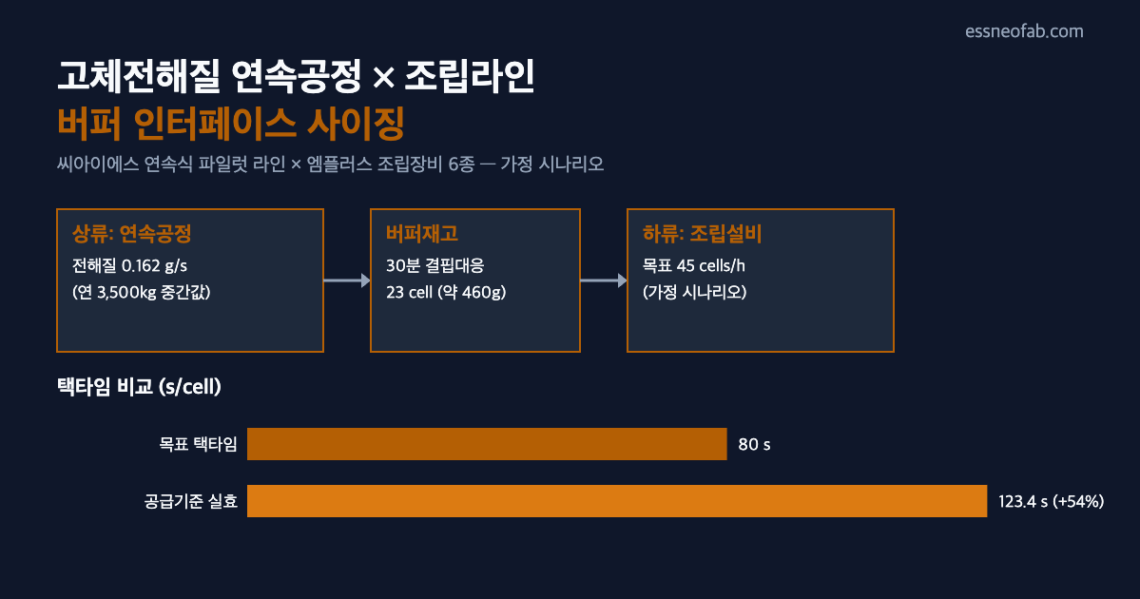
Between the Continuous Solid-Electrolyte Process and the Assembly Line: How Should the Buffer Interface Be Designed?
CIS's continuous-process pilot line for sulfide-based solid electrolyte at its Daegu Plant 3 (2–5 t/year, expanded from the existing batch process's 840 kg) and M Plus's order for six types of all-solid-state battery assembly equipment (targeting development/fabrication completion by end-2026) reveal a textbook interface problem: the production capacities of the upstream materials process and the downstream assembly process are not scaled up on the same timeline. This article estimates, as an assumed scenario, the buffer stock and takt-time loss required between these two processes, to quantitatively pin down why the materials-assembly interface design is a leading variable for the line's overall OEE (Overall Equipment Effectiveness). The downstream assembly equipment's target…
You May Also Like
Pylontech’s 588 Ah and 601 Ah LFP Cells Enter Mass Production — Why Energy-Weighted Availability Stays the Same When the Cell Count Halves
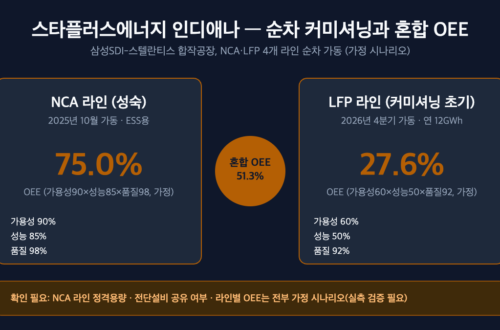
StarPlus Energy’s Indiana Plant — The Blended-OEE Illusion Created by Sequential NCA/LFP Commissioning
45 Days from Pohang to Georgia — Safety Stock at an Intercontinental Cathode Interface Is Driven by Lead-Time Variability, Not Demand
-
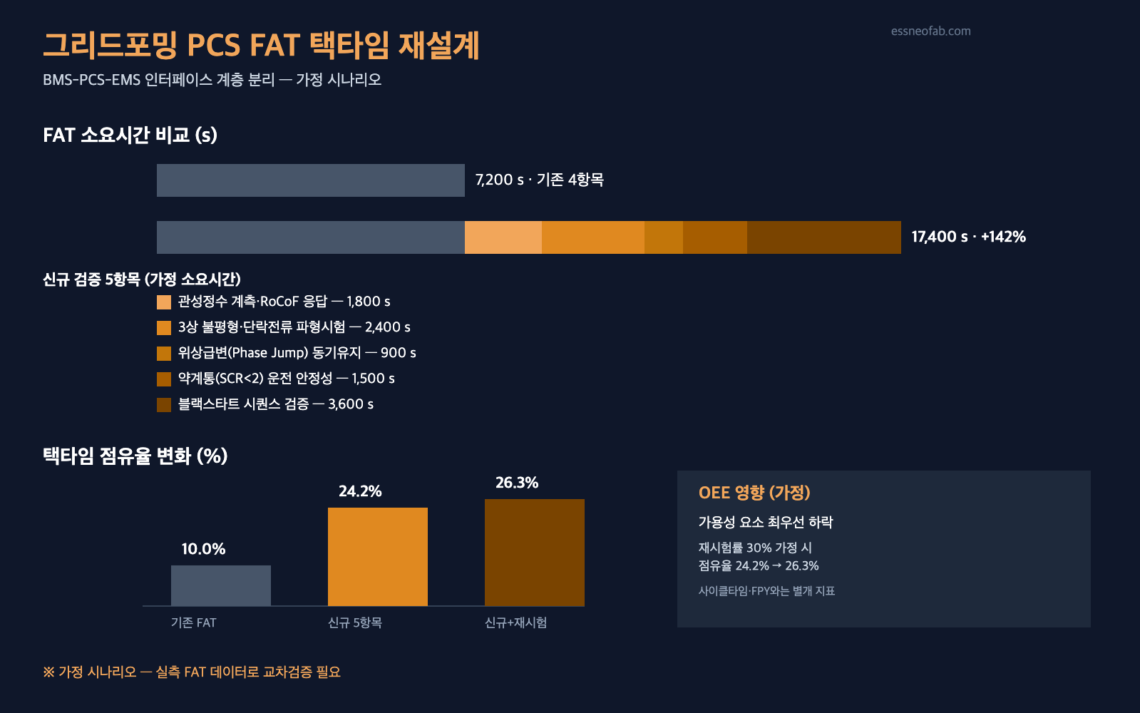
Grid-Forming PCS Mandate Redesigns FAT Takt Time and the BMS-PCS-EMS Interface
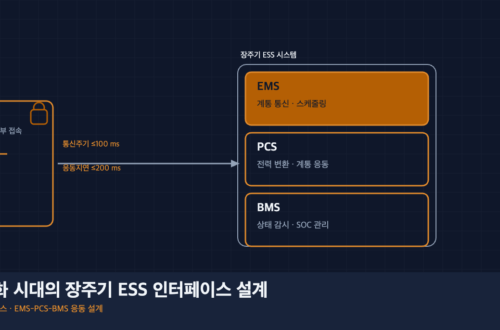
As grid-forming (GFM) inverter performance requirements become mandatory starting with long-duration BESS (Battery Energy Storage System) in the centralized-contract market scheduled for commercial operation in December 2027, five new verification stages are added to PCS (Power Conversion System) manufacturers' Factory Acceptance Test (FAT) lines. In an assumed-scenario calculation, per-unit FAT time increases by approximately 142% over the existing baseline, pushing the takt-time share from the 10% range to the 24% range, and if retests recur, the Availability factor of OEE (Overall Equipment Effectiveness) is the first to be shaken. At the same time, a design challenge emerges: a layer separation is needed between the grid-forming control loop, which requires sub-cycle…
You May Also Like
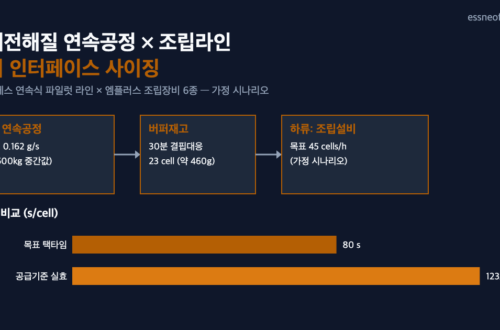
Between the Continuous Solid-Electrolyte Process and the Assembly Line: How Should the Buffer Interface Be Designed?
45 Days from Pohang to Georgia — Safety Stock at an Intercontinental Cathode Interface Is Driven by Lead-Time Variability, Not Demand
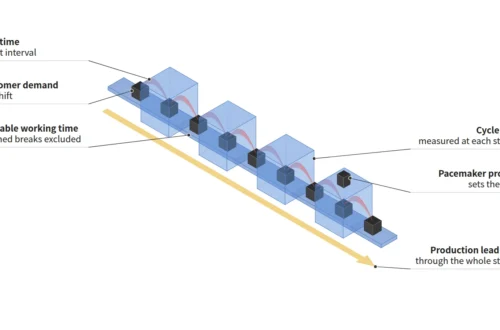
Don’t Subtract Breakdowns When Calculating Takt Time — Takt Time vs. Cycle Time vs. Lead Time
-
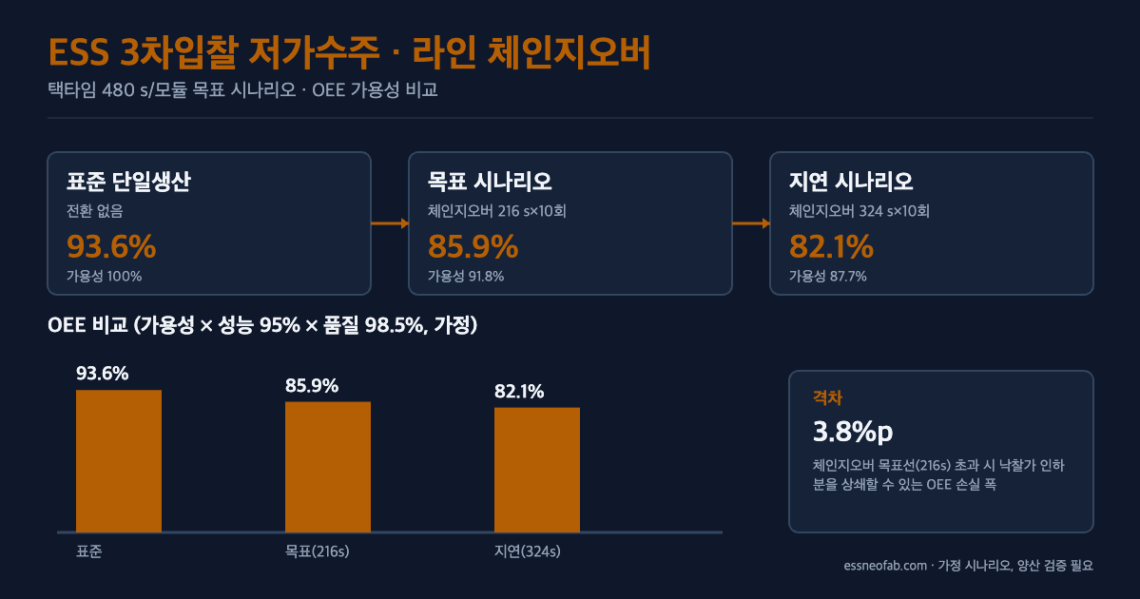
Line Changeover Design in the Era of Low-Price ESS Round-3 Bidding — Flexible Assembly Viewed Through Takt Time and OEE
Korea's ESS centralized-contract market Round-3 bid (approximately KRW 1 trillion), scheduled for announcement in September 2026, has already shown a decline in bid prices compared to Rounds 1 and 2, intensifying low-price order competition among the three battery makers. This article focuses on the possibility that this low-price order volume will require cell-format mixed-model flow on an existing single-model production line, and quantifies, as a target scenario, the impact of changeover time on takt time and the OEE Availability factor. The verification shows that controlling changeover time within the 216 s target versus exceeding it by 50% produces an OEE gap of approximately 3.8 pp. However, these figures are an…
You May Also Like
Two Cycles a Day Take 106.8 % of a Day, and the Retention Tier Shifts Cell Volume by 1.47 GWh
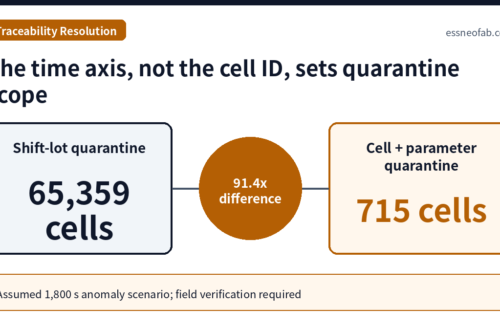
Recall and Quarantine Scope vs Traceability Resolution: Lot Tracking Compared with Cell-Plus-Parameter Tracking
Linking Cell History in Formation and Aging: History Contamination from Tray ID + Slot Mapping