Line Changeover Design in the Era of Low-Price ESS Round-3 Bidding — Flexible Assembly Viewed Through Takt Time and OEE
Abstract
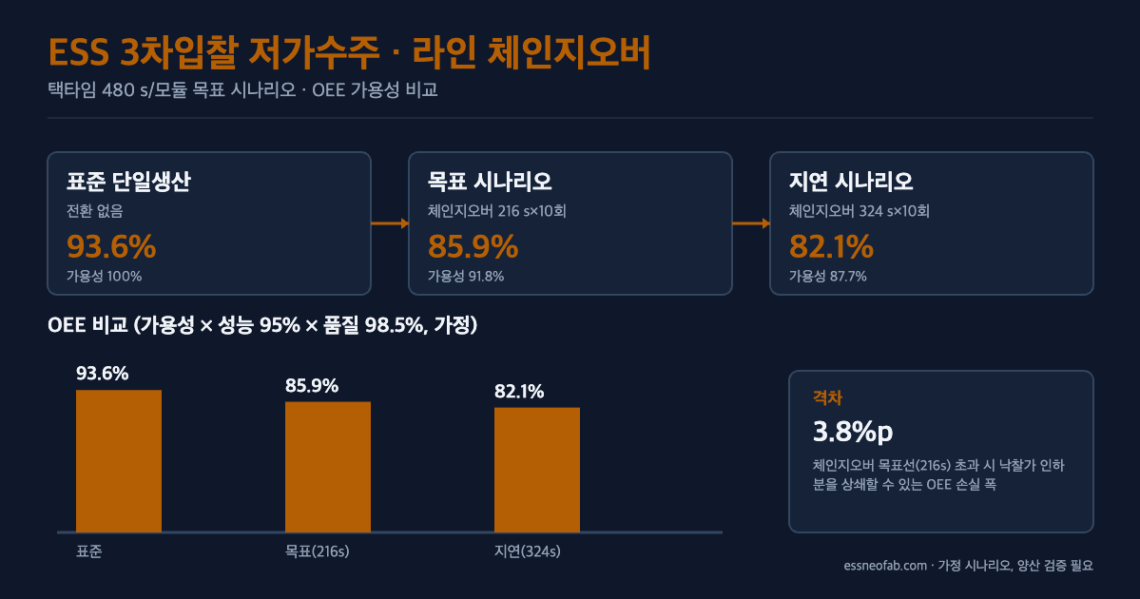
Korea’s ESS centralized-contract market Round-3 bid (approximately KRW 1 trillion), scheduled for announcement in September 2026, has already shown a decline in bid prices compared to Rounds 1 and 2, intensifying low-price order competition among the three battery makers. This article focuses on the possibility that this low-price order volume will require cell-format mixed-model flow on an existing single-model production line, and quantifies, as a target scenario, the impact of changeover time on takt time and the OEE Availability factor. The verification shows that controlling changeover time within the 216 s target versus exceeding it by 50% produces an OEE gap of approximately 3.8 pp. However, these figures are an assumed scenario constructed from disclosed bid-size and volume information, and further pilot verification is needed before application to an actual mass-production line.
1. Low-Price Orders Are the Result — the Cause Is the Line’s Conversion Capability
To state the conclusion first: the recurring phenomenon in the ESS centralized-contract market of “the more you win, the more you lose” often stems not from the bid price itself, but from the rigidity of a line design that cannot absorb the awarded volume within the existing line’s takt time. In Korea’s ESS centralized-contract market, cumulative Round 1 and 2 order volume reached 1.13 GW, and the average bid price in the February 2026 Round 2 was reported to have fallen from Round 1 in July 2025. Round 3 is approximately KRW 1 trillion in size and is scheduled for announcement in September.
Situation: the three battery makers have entered a price-competition structure that accepts losses to secure volume. Complication: the awarded volume is often not a single specification but a low-volume, high-mix mix of specifications and capacities that vary by ordering entity. Question: when an assembly line designed for single-model standard production absorbs this mixed-model volume, which line variable determines the cost structure? Answer: changeover (model-conversion) time. If this variable is not controlled, the OEE Availability factor is eroded, and that loss can more than offset the bid-price reduction.
2. Redefining Takt Time: The Target Quantity Changes After a Low-Price Order
Takt time is defined as Available Operating Time / Customer Required Quantity (not used interchangeably with cycle time). Under the pre-Round-3 single-model standard-production regime, customer required quantity can be assumed at 40 modules/day. Setting available operating time at 26,400 s/day for one shift (excluding 2,400 s of planned downtime from a total of 28,800 s, assuming room-temperature conditions of 23±2°C), takt time is calculated as follows.
Takt time (standard) = 26,400 s ÷ 40 modules = 660 s/module
Assume that once the Round-3 low-price volume is reflected, customer required quantity rises to 55 modules/day. Under the same available-operating-time condition, takt time must shorten as follows.
Takt time (target) = 26,400 s ÷ 55 modules = 480 s/module
This required takt-time reduction, from 660 s to 480 s, is the real pressure the line must absorb. The problem is that this pressure directly collides with the changeover loss caused by cell-format mixed-model flow.
3. The 216 s Changeover Target Line and Its Correlation with OEE Availability
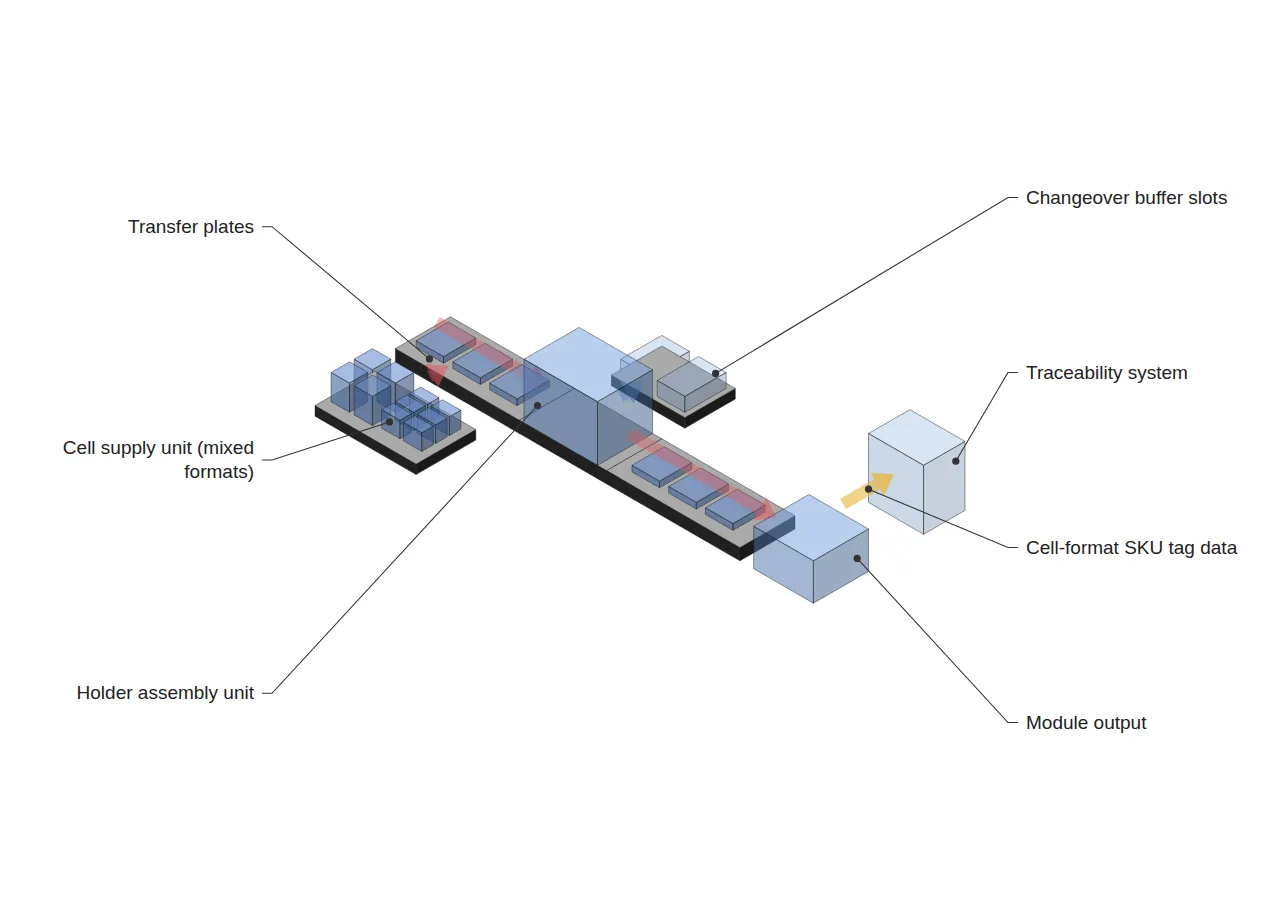
On a mixed-model production line, changeover refers to the non-operating interval that occurs during model conversion, similar to the separated transfer-plate/holder-assembly/cell-supply structure proposed by patent WO2024185998A1 (Flexible Manufacturing Apparatus/System for Battery Packs). This article sets the target changeover time at within 216 s (an arbitrary target figure, based on the flexible-manufacturing concept of the above patent and a back-calculation from the criterion of keeping erosion of available operating time within 8% assuming 10 model conversions per day).
Assuming 10 model conversions occur per day, comparing the target scenario (216 s changeover) against a delayed scenario (324 s changeover, 50% over target) yields the following.
| Category | Daily changeover loss | Available operating time | Availability | Performance (assumed) | Quality (assumed) | OEE |
|---|---|---|---|---|---|---|
| Standard single-model (no conversion) | 0 s | 26,400 s | 100% | 95% | 98.5% | 93.6% |
| Target scenario (216 s × 10) | 2,160 s | 24,240 s | 91.8% | 95% | 98.5% | 85.9% |
| Delayed scenario (324 s × 10) | 3,240 s | 23,160 s | 87.7% | 95% | 98.5% | 82.1% |
The OEE gap between the target scenario and the delayed scenario is 3.8 pp. If the Round-3 bid-price reduction margin is smaller than this gap, changeover-management failure alone could erode the bid margin. However, fixing the performance and quality factors at 95% and 98.5% is a simplifying assumption; in practice, the quality factor could also decline during the early stages of mixed-model production, and this requires separate verification.
4. Trend Snapshot — Carbon Traceability and Geographic Spread of Equipment Investment
Separately from this article’s core topic, two recently confirmed trends are recorded as a snapshot. No cross-verification has been performed, and they are reserved for future in-depth analysis.
First, CATL announced that all 20 of its operating battery plants have obtained ISO 14068-1 carbon-neutrality certification. From a line/system perspective, this can be interpreted as meaning that carbon data at the individual process-step level has been incorporated into a traceability system to a level that can be aggregated and certified, but whether carbon data is quantitatively reflected in domestic ESS bid-evaluation criteria requires separate review.
Second, US-based Forge Nano held a groundbreaking ceremony on August 19, 2026 to expand its Morrisville, North Carolina facility to approximately 315,000 sq ft. In that it scales up to a maximum of 3 GWh for the defense supply chain, this shows an equipment-investment motive on a different axis (defense/national supply-chain policy) from the domestic ESS bid competition addressed in the preceding sections.
5. Conclusion
Ahead of the ESS centralized-contract market’s Round-3 bid, the line-engineering response should be control of changeover time, not defense of the bid price. The 216 s target line presented in this article is not a measured figure from a specific company but a target scenario constructed by essneofab, and cross-verification through measured data for each cell format must precede application to an actual line. The meaningful conclusion is that in a low-price-order phase, the primary variable for cost defense is not the selling price, but the line’s conversion design.
Metric definitions: OEE (Overall Equipment Effectiveness) = Availability × Performance × Quality. In this article these metrics are not used interchangeably with Cycle Time or FPY.
FAQ
Q1. Doesn’t investing in a flexible production line raise initial CAPEX and actually worsen the profitability of low-price orders?
In the short term, that can be true. However, in this article’s scenario, the 3.8 pp OEE loss that a changeover delay (324 s) causes relative to the target (216 s) is a variable-cost-type loss that recurs every bidding cycle, whereas flexible-manufacturing equipment investment is a one-time fixed cost. The break-even point between the two costs depends on the recurrence cycle and size of the awarded volume, so this article does not conclude which is superior, and separate review is needed for each individual line.
Q2. What is the basis for fixing the performance and quality factors at 95% and 98.5%?
These are not measured values but assumed figures to simplify the calculation. There is a possibility that the quality factor also declines in the early stages of mixed-model production, which this article leaves as an open caveat.
Field Application Notes
The following items can be checked immediately in Monday-morning line meetings.
| No. | Check item | Measurement method | Target standard |
|---|---|---|---|
| 1 | Measure actual changeover | Stopwatch measurement at model-conversion points, 10+ samples | Within 216 s |
| 2 | Log deviation from target | Log the daily deviation of measured value minus target (216 s) | Within ±15% deviation |
| 3 | Mixed-flow waiting-buffer slots | Confirm the number of storage slots for work-in-progress awaiting model conversion | Secure at least 2 slots |
| 4 | SKU tag per cell format | Confirm existence of a cell-format code field in the Traceability system | Zero missing fields |
| 5 | Separate tally of OEE’s three factors | Weekly tally of Availability, Performance, and Quality as individual metrics rather than a combined index | At least once a week |
Related Reading
- The Equipment Maker’s Line-Ownership Shift — OEE and Takt-Time Design During the ESS-LFP New-Line Mass-Production Ramp-Up
- StarPlus Energy’s Indiana Plant — The Blended-OEE Illusion Created by Sequential NCA/LFP Commissioning
- Grid-Forming PCS Mandate Redesigns FAT Takt Time and the BMS-PCS-EMS Interface


One Comment
Pingback: