-
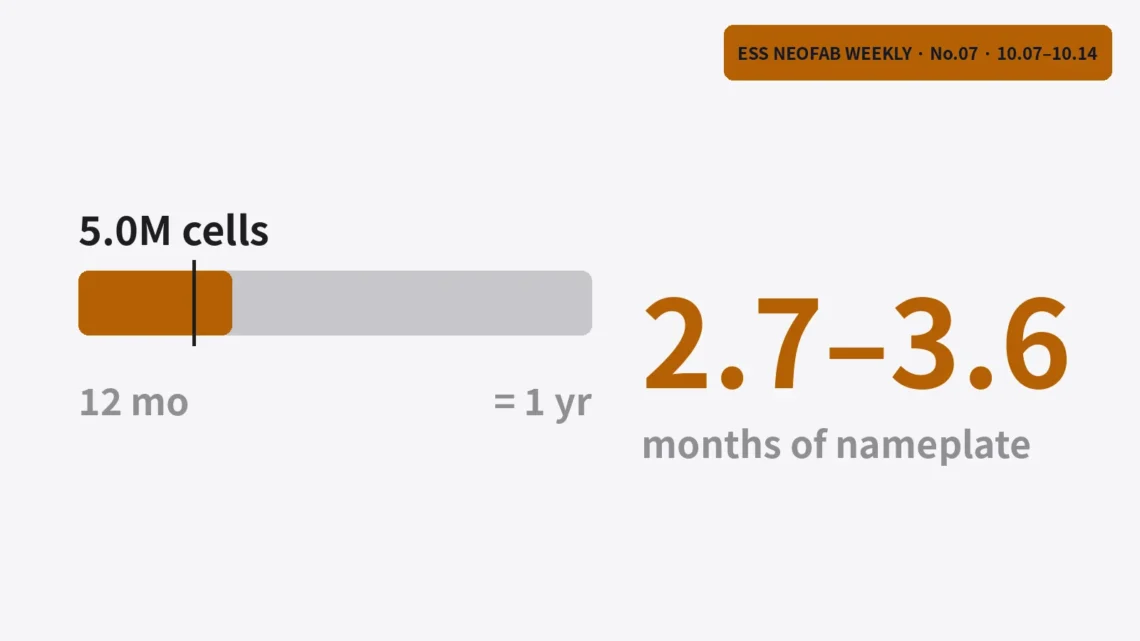
Five million ACC cells equal 2.7 to 3.6 months of nameplate output
ACC's Douvrin plant in France announced a running total of five million cells on 12 October 2026. Two figures in the coverage imply about 125 cells per vehicle, and assuming the first block runs at 13 GWh a year, five million cells equal 22.5 to 29.9 % of one nameplate year, or 2.7 to 3.6 months. Reports do not say how many years the total took, so average utilization can only be given as a range: 11.2 to 14.9 % over two years, 5.6 to 7.5 % over four. Applying the 15 to 20 % scrap rate reported in November 2025 would put 0.88 to 1.25 million scrapped cells behind…
You May Also Like
The Interface Between Laser Notching Cycle Time and Line Takt Time — The Head-Count Sizing Problem Revealed by DI ENT’s Ohio Supply Contract
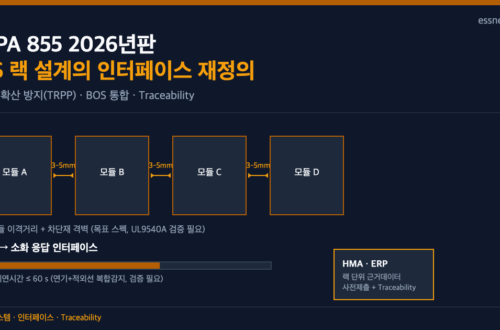
The 2026 Edition of NFPA 855 Changes ESS Rack Design and Traceability Documentation at the Same Time
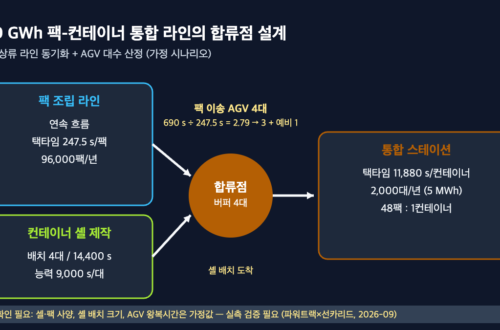
Designing the Merge Point in a 10 GWh Pack-Container Integration Line: Synchronizing Two Upstream Lines and Sizing AGV Fleet from the Powertrac × Sunka Lead Order
-
CATL Starts Trial Production in Debrecen — The Digits of the Defect-Rate Target, Not the Equipment, Set the Length of a Trial Run
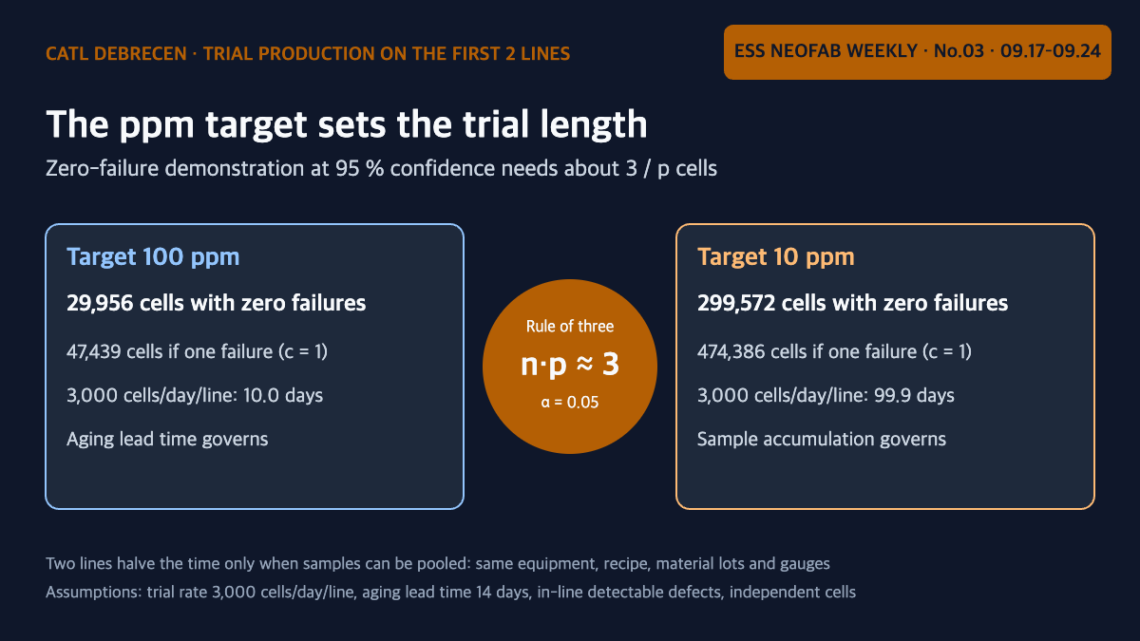
On September 22, 2026, CATL started trial production on the first two production lines of its cell plant in Debrecen, Hungary, stating that the purpose is "to set up, optimise and validate the production equipment and manufacturing processes ahead of series production"¹. If validation is defined as demonstrating a defect rate, a zero-failure demonstration at 95 % confidence requires 29,956 cells for 100 ppm and 299,572 cells for 10 ppm. Compared with an assumed aging-judgment lead time of 14 days, aging governs the trial length at a 100 ppm target, while sample accumulation governs it at 10 ppm. The second line halves the time only when samples are pooled, and…
-
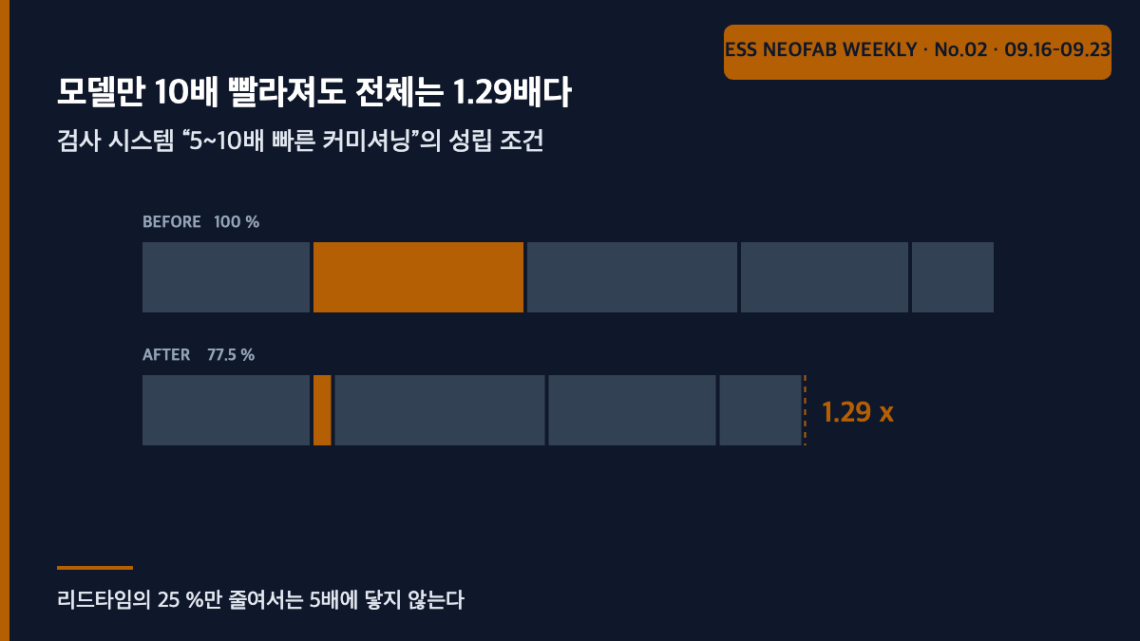
Even a tenfold faster model moves the whole by 1.29x — what “5 to 10 times faster commissioning” actually requires
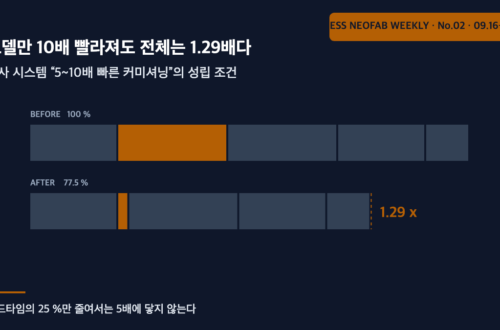
Siemens and P&G announced on 18 September 2026 that their VIC inspection platform commissions new deployments 5-10x faster. Re-read through Amdahl's law, accelerating the model stage (assumed 25 % share) tenfold shortens the whole by only 1.29x (22.5 %). For 5x to hold the accelerated scope must exceed 88.9 %, and 10x at a partial factor of 5 is arithmetically impossible. The bottleneck is not AI but the standardisation of lighting, mechanics, integration and handover.
You May Also Like
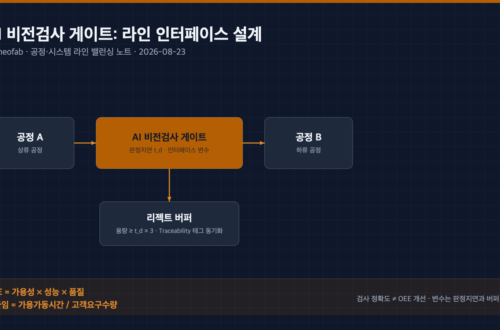
Embedding an AI Vision Inspection Gate in the Line: Redefining OEE and Takt-Time Design Variables
Designing the Merge Point in a 10 GWh Pack-Container Integration Line: Synchronizing Two Upstream Lines and Sizing AGV Fleet from the Powertrac × Sunka Lead Order
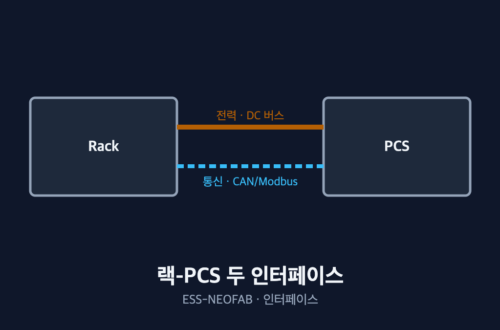
Between the Battery Rack and the PCS: Two Points Where the Interface Diverges
-
Is a Changeover Planned Downtime or an Availability Loss? — How the Definition Changes OEE
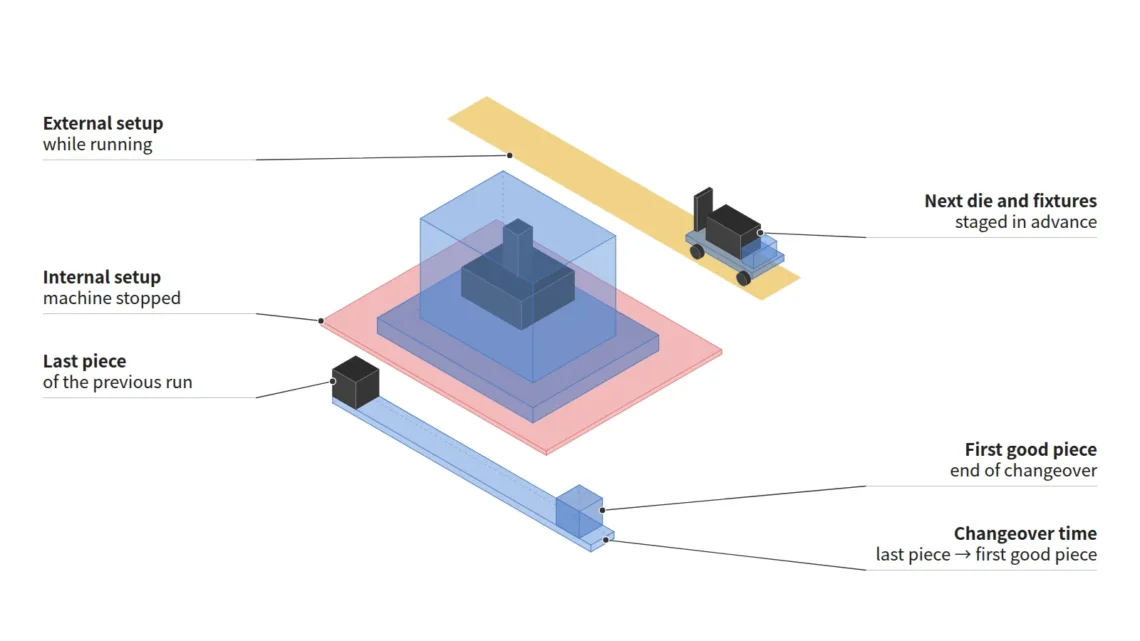
Whether a changeover (also called a setup) counts as planned downtime or as an availability loss differs from source to source, and because that choice alone changes availability and OEE substantially, changeover time must be tracked as a metric separate from OEE. The "Downtime" entry in the Lean Enterprise Institute (LEI) lexicon classifies changeovers to produce other products as planned downtime, while the Japan Institute of Plant Maintenance (JIPM) classifies setup and adjustment as a stop loss in availability. In an assumed shift (loading time 27,600 s, changeovers 3,000 s, breakdowns 600 s), availability is 87.0 % under the JIPM approach and 97.6 % under a planned-downtime approach that subtracts…
-
If Availability, Performance and Quality Are All 80 %, OEE Is 51.2 % — How to Calculate OEE
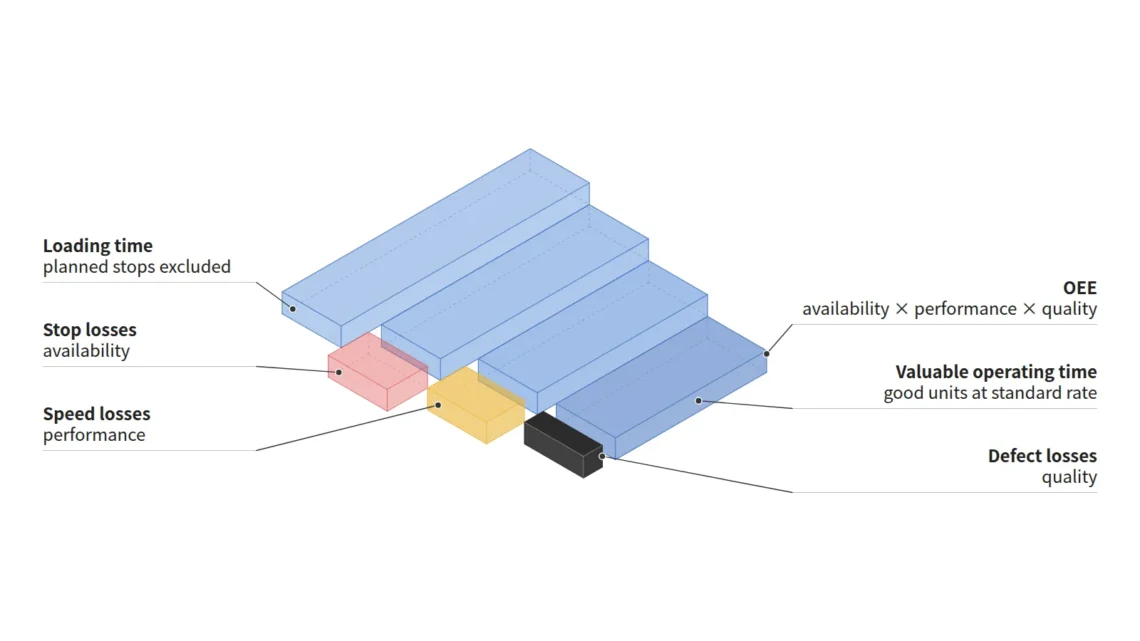
OEE (overall equipment effectiveness) is calculated as availability × performance × quality, and the Japan Institute of Plant Maintenance (JIPM) gives the example that when all three factors are 80 %, OEE is 51.2 %. When the three factors are multiplied as JIPM defines them, OEE is organized as "standard (planned) cycle time × number of good units ÷ loading time," that is, the share of loading time spent making good units at the standard speed. In an assumed shift (loading time 27,600 s, standard cycle time 32 s, 690 good units), availability is 90.0 %, performance 90.4 % and quality 98.3 %, giving an OEE of 80.0 %. If…
You May Also Like
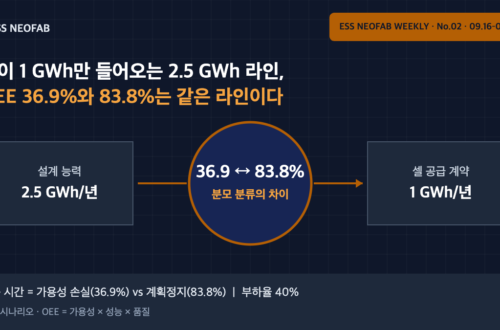
A 2.5 GWh Line Fed Only 1 GWh of Cells — OEE of 36.9% and 83.8% Describe the Same Line
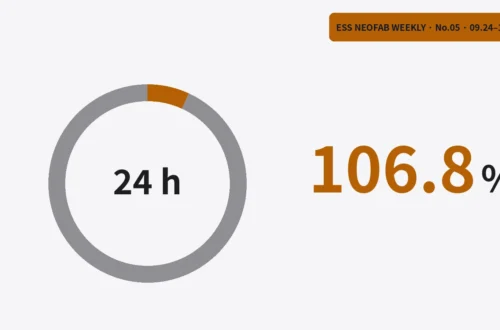
Two Cycles a Day Take 106.8 % of a Day, and the Retention Tier Shifts Cell Volume by 1.47 GWh
The Interface Between Laser Notching Cycle Time and Line Takt Time — The Head-Count Sizing Problem Revealed by DI ENT’s Ohio Supply Contract
-
A 2.5 GWh Line Fed Only 1 GWh of Cells — OEE of 36.9% and 83.8% Describe the Same Line
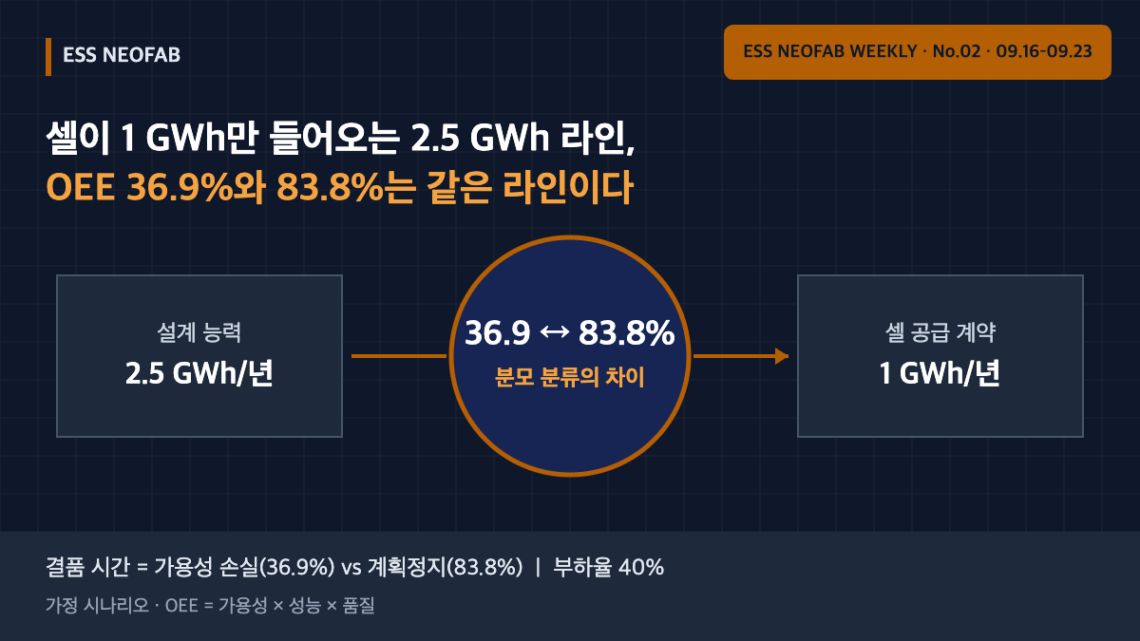
Advait Group’s supply agreement with Hithium for 314 Ah LFP cells (up to 1 GWh over the next year, 18 September 2026) feeds a 2.5 GWh/yr assembly plant with only 40% of its design capacity. Under an assumed scenario, the same line with the same output reports an OEE of 36.9% if cell-shortage time is counted as availability loss, and 83.8% if it is separated as planned downtime and available operating time is matched to supply. The 46.9-point gap comes from the OEE denominator rule, not the equipment; on supply-constrained lines, the loading ratio should be reported alongside OEE.
You May Also Like
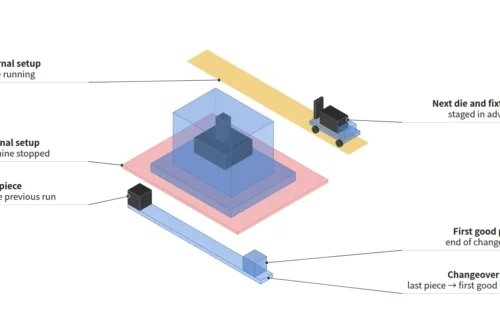
Is a Changeover Planned Downtime or an Availability Loss? — How the Definition Changes OEE
Designing the Merge Point in a 10 GWh Pack-Container Integration Line: Synchronizing Two Upstream Lines and Sizing AGV Fleet from the Powertrac × Sunka Lead Order
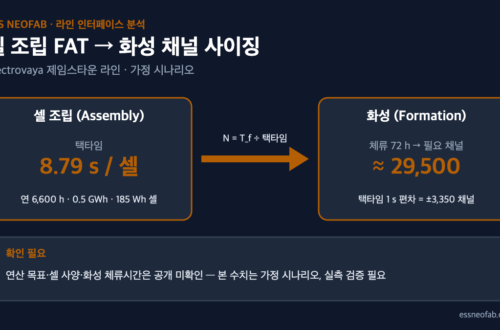
Formation Channel Sizing Read from a Cell Assembly Equipment FAT — How 1 Second of Takt Time Moves 3,350 Channels
-
StarPlus Energy’s Indiana Plant — The Blended-OEE Illusion Created by Sequential NCA/LFP Commissioning
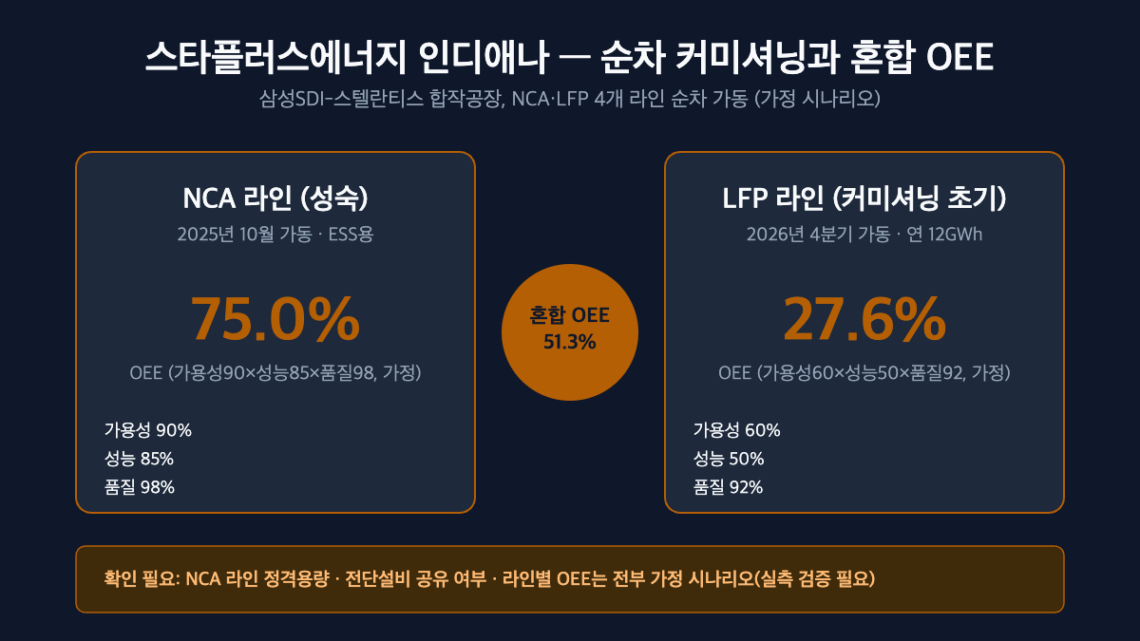
The Samsung SDI–Stellantis joint venture StarPlus Energy's Indiana (Kokomo) plant is bringing four lines online in sequence over 18 months: an NCA line starting October 2025, an LFP line (12 GWh/year) in Q4 2026, and additional NCA and LFP lines in Q1 2027. When lines of different chemistries (NCA, LFP) and end uses (EV, ESS) are commissioned at different times within a single site, a “Blended OEE” that sums the entire site into one number creates an illusion that obscures the actual performance of mature lines. This article back-calculates Takt Time from the publicly disclosed line-startup schedule and compares site-level blended metrics against line-level OEE under an assumed scenario. The…
-
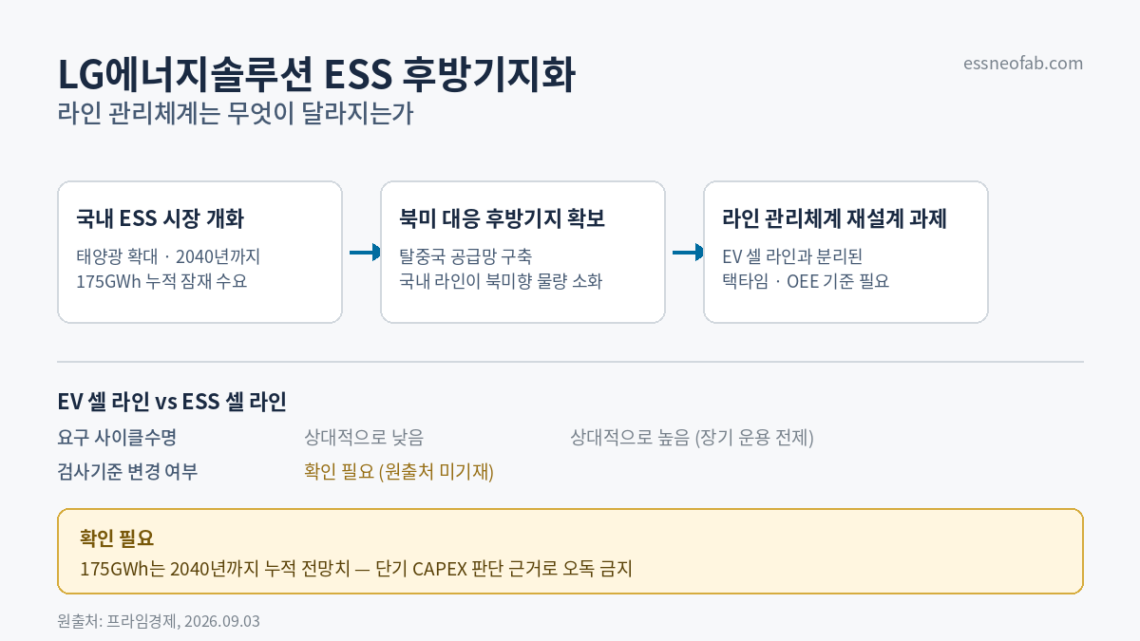
LG Energy Solution’s ESS Rear-Base Positioning — What Changes in Line Management
As Korea's domestic ESS market opens up, a trend is forming in which LG Energy Solution secures a role as a rear base responding to North American demand. Driven by solar power expansion, potential cumulative ESS battery demand of 175 GWh is projected through 2040, alongside attention to the effect of building a China-independent supply chain. However, absorbing this volume in domestic lines requires a takt time (Takt Time)¹ and OEE (Overall Equipment Effectiveness)² management system separate from existing EV cell lines, and the relevant detailed criteria are not given in the original source and require separate verification. 1. Situation and Challenge The opening of Korea's domestic ESS market is…
You May Also Like

Converting EV Lines to ESS: What the H1 Utilization Gap Reveals About Line-Conversion Speed
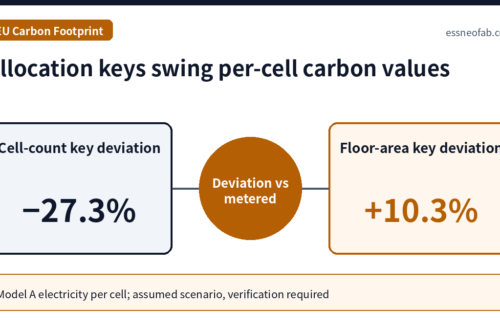
EU Battery Carbon Footprint Methodology Still Pending: How Line Energy Metering Resolution and Allocation Choice Shift Per-Cell Values
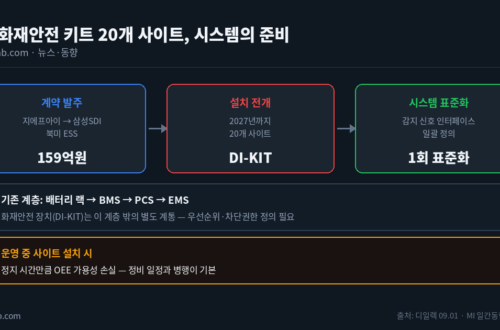
ESS Fire-Safety Kits Across 20 Sites — What the System Must Prepare
-
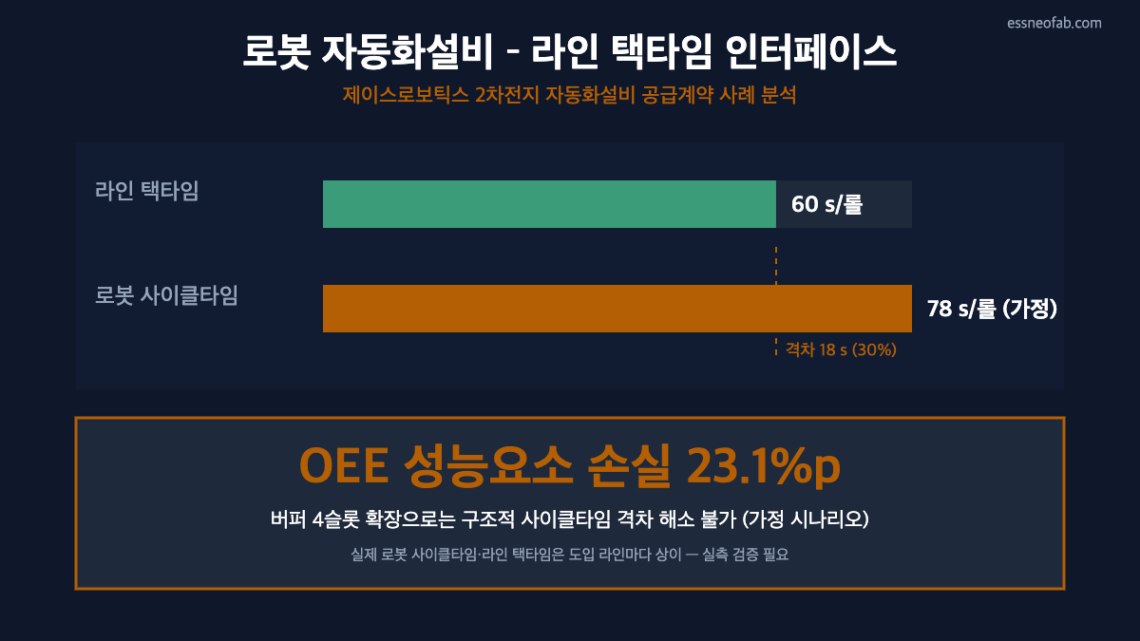
Introducing Robotic Automation Equipment — Where Does the Interface with Line Takt Time Break Down
The supply contract disclosed by JS Robotics on September 2, 2026, worth roughly KRW 33.26 billion, for battery-manufacturing robotic automation equipment brings renewed attention to the Cycle Time-Takt Time gap that arises the moment new robotic equipment is connected to an existing R2R (Roll-to-Roll) line. This article calculates an assumed scenario in which one cycle of robotic automation equipment exceeds the line takt time, distinguishing the range of variation that buffer accumulation design can absorb from the structural gap it cannot. The analysis concludes that buffers absorb only micro-stop-level variation, and that a structural gap where the robot's own cycle time exceeds takt time translates directly into OEE performance-factor loss,…
-
LFP High-Compaction-Density Conversion and the Calendering Interface: How Nip Pressure and Line Speed Affect Takt Time
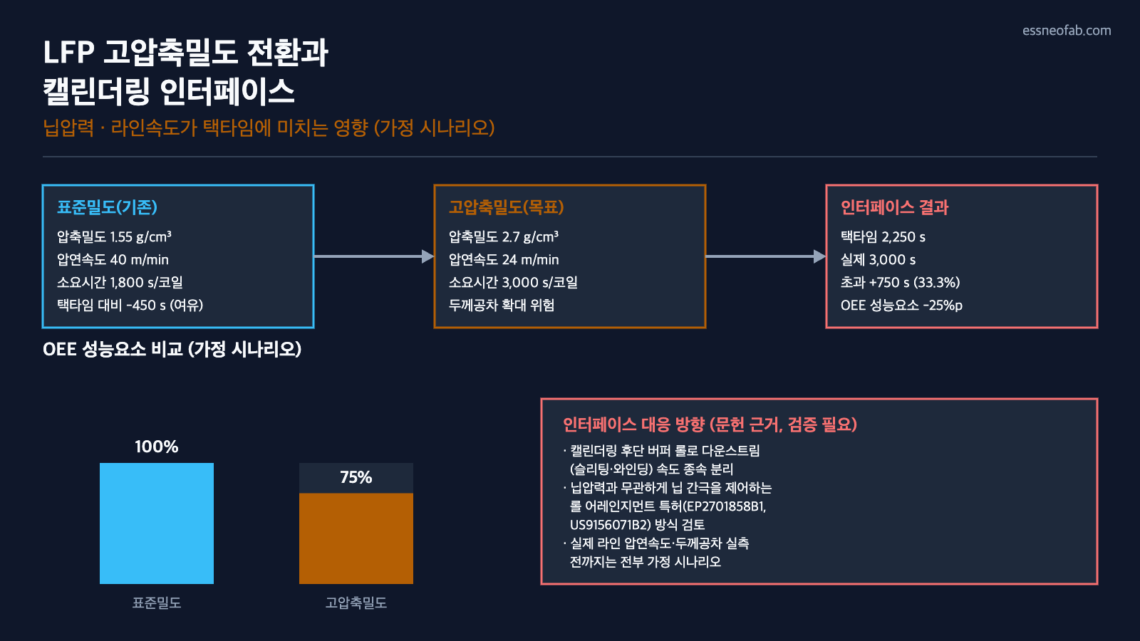
If the compaction density target for LFP (Lithium Iron Phosphate) cathode material — typically in the 1.4–1.6 g/cm³ range — is raised to the 2.7 g/cm³ class that L&F has disclosed as its end-2026 mass-production target, the nip pressure and line speed of the calendering (rolling) process must be redesigned, and this directly affects the takt time and OEE (Overall Equipment Effectiveness) performance factor of existing operating lines. In an assumed-scenario calculation, if the rolling speed decelerates from 40 m/min to 24 m/min, the calendering time per coil (1,200 m) increases from 1,800 s to 3,000 s, creating a bottleneck that exceeds the 2,250 s takt time by 750 s…
You May Also Like
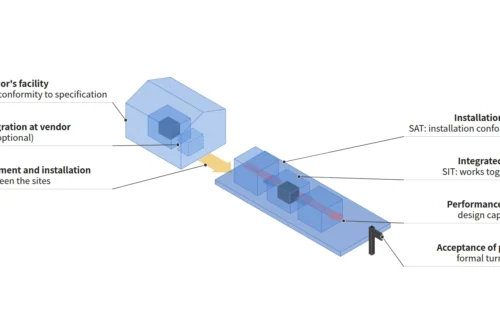
FAT and SAT Differ in More Than Location — How IEC 62381:2024 Defines the Tests
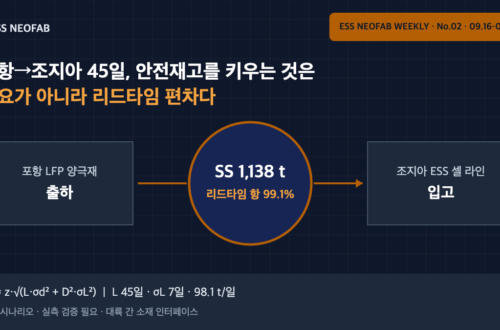
45 Days from Pohang to Georgia — Safety Stock at an Intercontinental Cathode Interface Is Driven by Lead-Time Variability, Not Demand
The 2026 Edition of NFPA 855 Changes ESS Rack Design and Traceability Documentation at the Same Time