Linking Cell History in Formation and Aging: History Contamination from Tray ID + Slot Mapping
Abstract
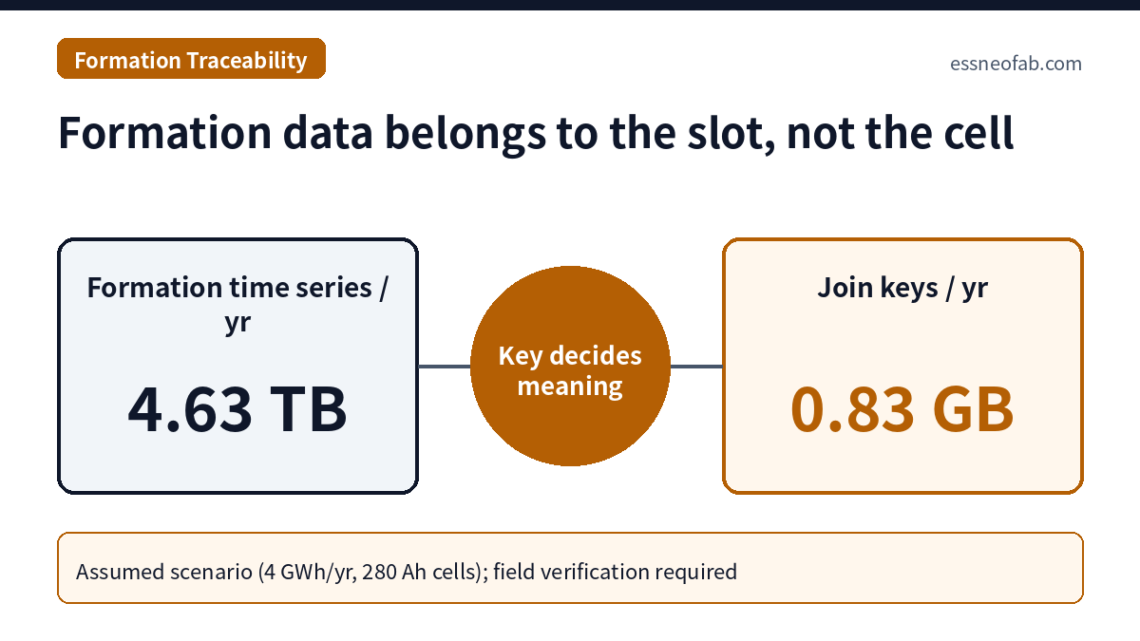
Measurement data in the formation and aging section are generated against equipment channels and tray slots, not against cell IDs; the completeness of cell history is therefore determined not by measurement accuracy but by the integrity of a join key composed of tray ID + slot position + load event. On an assumed line processing about 4.46 million cells per year, formation time series occupy about 1.04 MB per cell and about 4.63 TB per year, while the join-key record is 186 byte per cell, less than 0.02% of the total.
Yet a slot misplacement rate of only 10 ppm per load event contaminates the history of about 268 cells per year, and a single slot swap distorts the K values of two cells at once, pairing a passed defective cell with a scrapped good cell. Storage sizing and history-integrity sizing are thus separate design problems, and the first check is whether re-reading the cell ID at every reload point (about 7.8% of tray takt time, assumed) costs less than the contamination.
1. Conclusion First — Formation Data Belongs to the Slot, Not the Cell
Every measurement generated in the formation[1] and aging[2] section is recorded as “which channel, which slot”, and the cell ID is attached only by a downstream join. If that join key slips even once, the data become accurate measurements assigned to the wrong owner.
Situation (S): At the end of assembly, cells are loaded onto trays and then pass formation charge/discharge, high-temperature and room-temperature aging, OCV[3] measurement and self-discharge (K value[4]) judgment tray by tray. Complication (C): This section has the longest process dwell, and cells are unloaded from and reloaded onto trays several times. Question (Q): What key correctly attaches channel and slot data recorded by the equipment to a cell ID, and where does that key break? Answer (A): The key must not be a static “tray ID + slot” but a time-scoped key “tray ID + slot + load event ID” issued anew at each load event, and every reload point is a break point.
This article does not address formation channel counts or dwell-time sizing. It quantifies, from a line perspective, only the structure of the data join key, the paths by which the key is contaminated, and the cost of preventing contamination.
2. Mechanism — A Two-Step Join from Channel to Slot to Cell ID
A formation charger/discharger records measurements as “rack ID + channel number”. The correspondence between channel and tray slot is configuration data fixed by the equipment’s pin layout, whereas the correspondence between slot and cell ID is operational data recorded by the MES[5] at loading. Finding one cell’s formation curve therefore always requires a two-step join: channel→slot (equipment configuration) and slot→cell ID (loading record).
The problem is that the second join changes over time. Slot 3 of the same tray holds cell A today and cell B tomorrow. If the key consists only of tray ID and slot number, past and current histories share the same address the moment a tray is reused, and the join comes to depend on timestamp range comparison. This is why a load event ID[6] is included in the key.
| Data source | Equipment-side address | Record size per cell (assumed) | Annual size (assumed) | Link to cell ID |
|---|---|---|---|---|
| Formation and capacity-check charge/discharge time series | Rack ID + channel | 43,200 s × 1 s sampling × 24 byte ≈ 1.04 MB | about 4.63 TB | Channel→slot→cell ID (two-step join) |
| Three OCV measurements (OCV1–OCV3) | Measurement tray ID + slot | 3 × 38 byte = 114 byte | about 0.51 GB | Slot→cell ID (one-step join) |
| Join-key records (three load events) | — | 3 × 62 byte = 186 byte | about 0.83 GB | The key itself |
The baseline in Table 1 is the formation time series. The join-key record is only about 0.018% of the formation time series. Raising sampling to 0.1 s increases the time series tenfold to about 46.3 TB per year, while the join key does not change. The implication is clear: data-volume estimation is dominated by per-channel sampling, but the meaning of all 4.63 TB is determined by a single 0.83 GB key table.
3. Contamination Path — One Slot Misplacement Flips Two K Values
Because the K value is the difference between two OCV readings divided by elapsed time (K = ΔOCV / Δt), calculating one cell’s K value requires two records measured at different load events to be linked to the same cell ID. OCV-based screening after aging is reported to typically require an observation period on the order of 360,000–1,440,000 s, and if even one reload occurs within that period, the two OCV readings travel different join paths.
A slot misplacement then does not end as a single error. If cells A and B swap slots during reloading, cell B’s value enters cell A’s OCV2 position and vice versa. As a result, the K value of a high self-discharge cell is calculated as small and that of a normal cell as large, so that a passed defective cell and a scrapped good cell occur as a pair. This is why each misplacement is counted as two contaminated cells.
| Scenario | Slot misplacement rate per load event (assumed) | Annual misplacements | Annual cells with contaminated history | vs. baseline (S1) |
|---|---|---|---|---|
| S1. Manual reloading, no cell ID re-read | 100 ppm | about 1,339 | about 2,679 cells | Baseline |
| S2. Robotic reloading, no cell ID re-read | 10 ppm | about 134 | about 268 cells | −90% |
| S3. Robotic reloading + cell ID re-read at reload (0.1% fallback to slot inference on read failure) | 0.01 ppm (residual) | about 0.13 | about 0.27 cells | −99.99% |
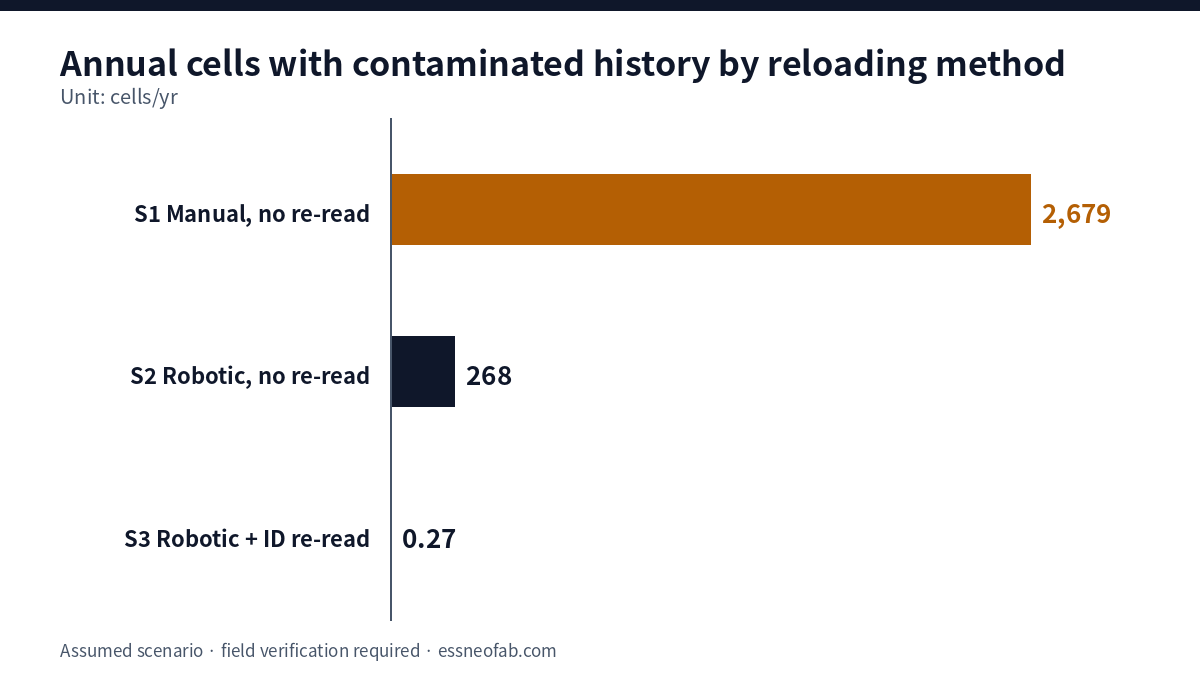
Against baseline S1, S2 cuts contamination by 90% through equipment automation alone, yet about 268 cells per year are still judged with incorrect K values. S3 differs in nature in that it does not prevent misplacement itself but “detects” it. The implication is that investment in re-verifying the key at every reload point is at least an order of magnitude more effective than investment in lowering the misplacement rate.
Re-read cost can be examined against takt time[7]. Available operating time of 28,512,000 s (86,400 s × 330, assumed) ÷ 4,464,286 cells per year = about 6.39 s per cell, giving a tray takt time of about 127.7 s for a 20-slot tray. Even with a serial re-read of 0.5 s per cell (assumed), the load is 10 s per tray, about 7.8% of tray takt time, which can be absorbed; parallel reading reduces this share further.
4. Design Comparison and Limits of Application
Join-key design reduces to three options. First, a static tray ID + slot key is simple to implement but depends on timestamp range joins when trays are reused. Second, a time-scoped key including the load event ID turns history lookup into a single join. Third, re-reading the cell ID at every reload point to verify slot mapping shifts contamination handling from “after-the-fact tracing” to “on-the-spot blocking”.
This structure differs from Cell History Management: Where Does It Break at the Line Level?, which covers break points across cell history in general. Whereas that article locates breaks across the entire process, this one dissects the structure of the key itself within the single formation and aging section. The relationship between formation dwell time and channel count is a capacity problem treated in Cell Assembly FAT and Formation Channel Sizing, a variable independent of the data linkage problem here.
The limits of application are also clear. The figures here result from assumed cell specifications, tray slot counts, load event counts and misplacement rates, so the absolute number of contaminated cells requires field verification. In addition, EU Battery Regulation (2023/1542) requires a battery passport for industrial batteries above 2 kWh and others from 18 February 2027, but whether the passport extends to cell-level formation data is not stated in the public summaries reviewed, so confirmation is required.
5. Conclusions and Implications
Data design for the formation and aging section must be split into two problems: “how much to store” and “whose data it is”. The former is dominated by per-channel sampling and grows by several TB per year, while the latter is decided entirely by a 186 byte join key per cell. The moment the two are bundled into a single storage specification, key integrity drops out of the managed scope.
In practice, the first step is to count reload points. A new key is issued at each reload point, and each one is an entry point for contamination. Driving the misplacement rate to zero is impossible, but, according to this assumed scenario, converting misplacements into detectable events through cell ID re-reading at reload is achievable at a cost of a single-digit percentage of tray takt time.
FAQ
Q. Wouldn’t misplaced cells show up as outliers in the K value distribution? Is re-reading really necessary?
A. In most cases they do not show up. A pair swap merely exchanges two cells’ values and barely changes the mean and variance of the population distribution. When two normal cells swap, both K values stay in the normal range; when a defective and a normal cell swap, the defect judgment simply moves to the wrong cell. Distribution-based after-the-fact detection lacks a controlled variable and cannot discriminate with statistical significance, so key verification must be performed at the time of measurement.
Q. Doesn’t attaching RFID to trays solve the slot mapping problem?
A. Tray RFID guarantees the tray ID only; it does not guarantee the correspondence between slots and cells within the tray. Because contamination arises from cell placement within slots rather than tray identification, the line remains at the S2 level without a cell-level identification means.
Field Application Notes
The following items can be executed on Monday morning.
| Check | How to execute | Remarks |
|---|---|---|
| ☐ List reload points between formation and OCV | Mark every point on the process flow where cells leave a tray and are loaded again, and record whether the cell ID is read at each point | The number of reload points without reading equals the number of contamination entry points |
| ☐ Check whether the join key includes a load event ID | Check in the MES loading-table schema whether the key is only tray ID + slot or includes an event ID | If there is no event ID, review the timestamp range join logic |
| ☐ Check version control of channel→slot configuration | Verify that equipment pin-layout changes and channel replacements remain in the configuration table with dates | If data before and after a configuration change are joined with the same mapping, the entire two-step join is contaminated |
| ☐ Sample tray re-read audit | Select five trays just before OCV measurement, manually re-read cell IDs and compare them with the MES slot mapping | If even one mismatch appears, replace the assumed misplacement rate in Table 2 with your own value |
| ☐ Estimate the takt time impact of re-reading | Compare read time per cell × slot count with tray takt time | About 7.8% under this article’s assumptions; recalculate under your own conditions |
Footnotes
[1] Formation: The process of applying the first charge/discharge to an assembled cell to make it electrically usable. In this article it is treated only as a line data-generation section.
[2] Aging: A dwell process in which cells are held for a set time after formation to allow voltage stabilization and defect screening.
[3] OCV (Open Circuit Voltage): Cell terminal voltage measured with no load connected.
[4] K value: A self-discharge judgment metric obtained by dividing the difference between two OCV readings by elapsed time (K = ΔOCV / Δt).
[5] MES (Manufacturing Execution System): The shop-floor operations system that records and traces process results, material movements and quality data.
[6] Load Event ID: A unique identifier assigned to a single act of placing a cell into a specific tray slot. It is the key element separating past and current histories when trays are reused.
[7] Takt Time: Available operating time ÷ customer demand quantity. Not to be confused with Cycle Time or FPY.
Sources: HIOKI, “Lithium-ion Battery Open-circuit Voltage (OCV) Testing”, https://www.hioki.com/us-en/industries-solutions/manufacturing/liion-ocv-test.html (OCV-based defect detection typically requires 360,000–1,440,000 s, converted). Bob Zollo, “Measure Self-Discharge Using OCV on Lithium-Ion Cells”, Electronic Design, 2019-07-30, https://www.electronicdesign.com/technologies/test-measurement/article/21808344/keysight-technologies-measure-self-discharge-using-ocv-on-lithium-ion-cells. Regulation (EU) 2023/1542, EUR-Lex, https://eur-lex.europa.eu/eli/reg/2023/1542/oj/eng. “Battery passport”, Wikipedia, https://en.wikipedia.org/wiki/Battery_passport (applies from 2027-02-18 to LMT, industrial above 2 kWh and EV batteries). “Article 77 Battery Passport”, TracePass, https://www.tracepass.eu/regulatory/battery-articles/article-77.
Measurement & Calculation Conditions: Line capacity of 4 GWh/year, 280 Ah, 3.2 V cells (about 4,464,286 cells per year), available operating time of 28,512,000 s (86,400 s × 330), 20-slot trays, three load events per cell, 43,200 s of formation and capacity-check charge/discharge with 1 s sampling and 24 byte records, 38 byte OCV records, 62 byte join-key records, slot misplacement rates of 100 ppm / 10 ppm / 0.01 ppm (residual) and a re-read time of 0.5 s per cell are all assumed values. Results vary with equipment configuration, work methods and tray specifications, so field verification is required, and pilot-condition results are not applied 1:1 to mass-production lines.


You May Also Like
Edge AI Vision Inspection and Battery-Pack Leak Testing: How Gateway Aggregation Affects Traceability Completeness
Converting EV Lines to ESS: Where Does OEE Break Down?