본문으로 바로가기
Ess-neofab

A line- and system-level record of ESS and secondary-battery manufacturing processes

  • 한국어
  • English
  • Home
  • Process
  • System
  • Interface
  • Traceability
  • News & Trends
  • About
  • Contact
  • 한국어
  • English
  • Home
  • Process
  • System
  • Interface
  • Traceability
  • News & Trends
  • About
  • Contact

카테고리

  • Interface (28)
  • News & Trends (20)
  • Process (32)
  • System (31)
  • Traceability (22)

최근 글

  • Five million ACC cells equal 2.7 to 3.6 months of nameplate outputOctober 15, 2026
  • A 160 MW battery’s six-week commissioning has two baselinesOctober 8, 2026
  • Two Cycles a Day Take 106.8 % of a Day, and the Retention Tier Shifts Cell Volume by 1.47 GWhOctober 1, 2026
  • Battwoo’s Second-Life EV Batteries — When an 80 % Acceptance Threshold Overlaps the Retirement Distribution, Incoming Screening Becomes the BottleneckSeptember 30, 2026
  • US storage set an energy record in Q2 as installed power fell 7%September 29, 2026
  • CATL Starts Trial Production in Debrecen — The Digits of the Defect-Rate Target, Not the Equipment, Set the Length of a Trial RunSeptember 29, 2026
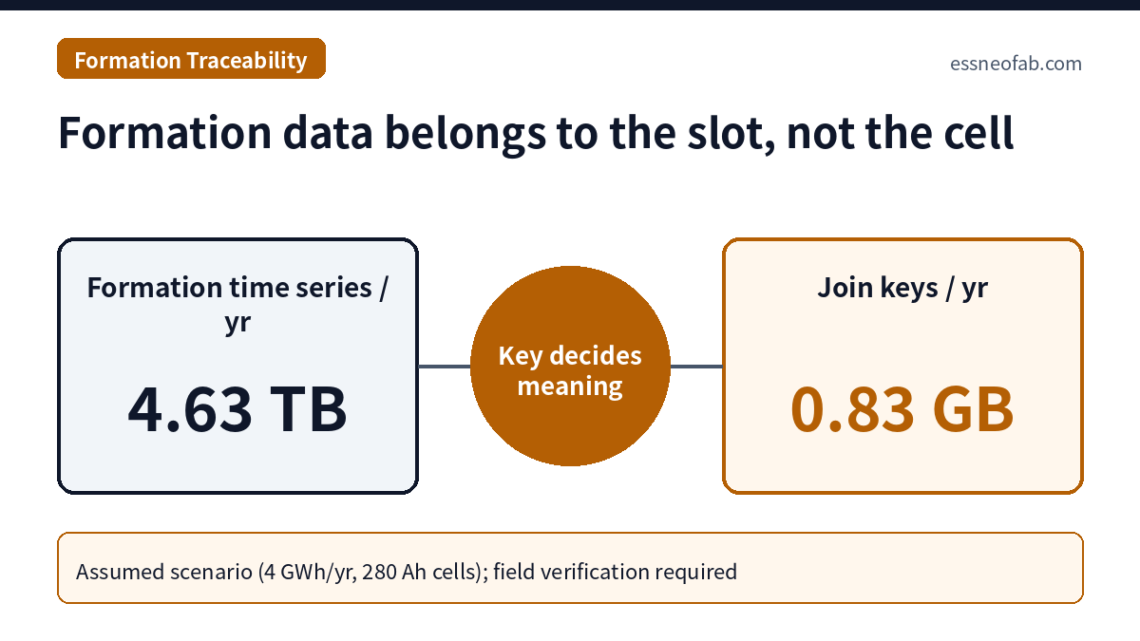
  • Formation data belongs to the slot, not the cell
    Process,  Traceability

    Linking Cell History in Formation and Aging: History Contamination from Tray ID + Slot Mapping

    July 11, 2026 /

    Measurement data in the formation and aging section are generated against equipment channels and tray slots, not against cell IDs; the completeness of cell history is therefore determined not by measurement accuracy but by the integrity of a join key composed of tray ID + slot position + load event. On an assumed line processing about 4.46 million cells per year, formation time series occupy about 1.04 MB per cell and about 4.63 TB per year, while the join-key record is 186 byte per cell, less than 0.02% of the total. Yet a slot misplacement rate of only 10 ppm per load event contaminates the history of about 268 cells…
    read more
    ESS-neofab Comments Off on Linking Cell History in Formation and Aging: History Contamination from Tray ID + Slot Mapping

    You May Also Like

    Inter-Process Buffers: Bigger Isn’t Always Better

    August 13, 2026
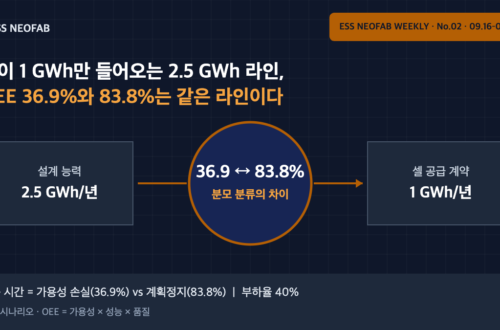
    설계 능력 2.5 GWh와 셀 공급 1 GWh 조건에서 OEE가 36.9% 또는 83.8%로 보고되는 분모 분류 차이 도식

    A 2.5 GWh Line Fed Only 1 GWh of Cells — OEE of 36.9% and 83.8% Describe the Same Line

    September 25, 2026
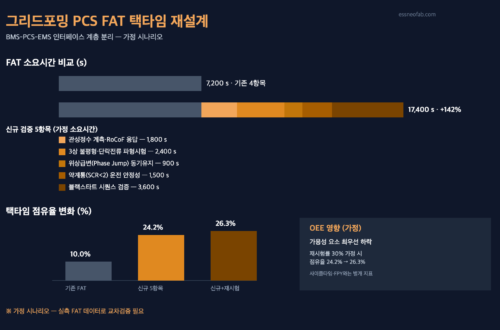
    그리드포밍 PCS FAT 택타임 비교 및 택타임 점유율 변화 도식

    Grid-Forming PCS Mandate Redesigns FAT Takt Time and the BMS-PCS-EMS Interface

    August 31, 2026
© 2026 Ess-neofab · A line- and system-level record of ESS and secondary-battery manufacturing processes
  • About
  • Contact
  • Privacy Policy
  • Disclaimer
Ashe Theme by WP Royal.