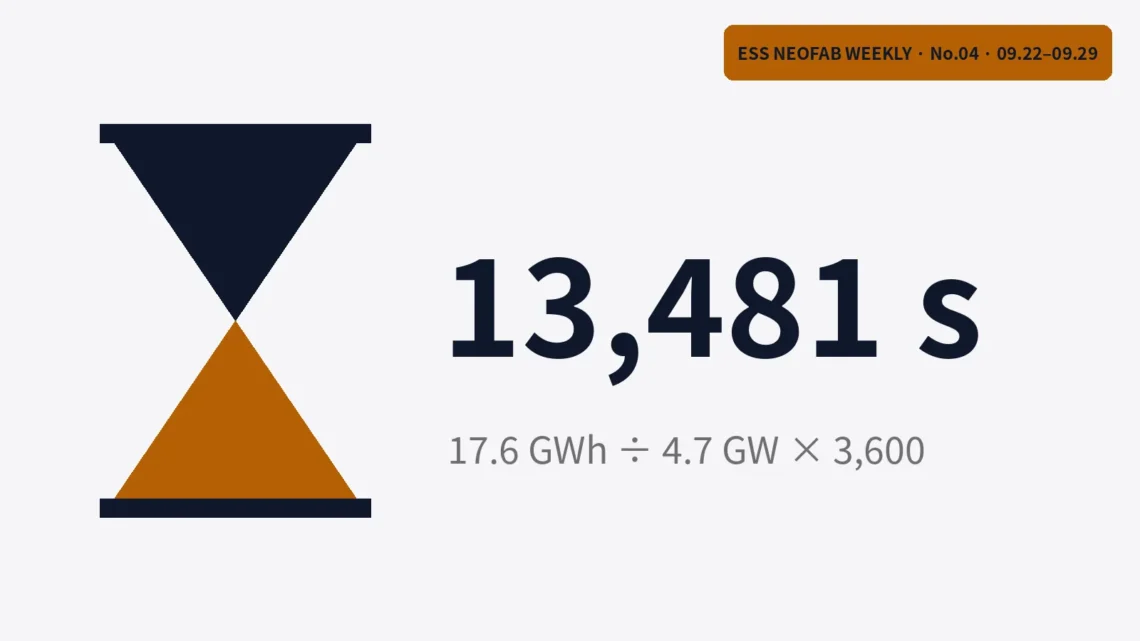
US storage set an energy record in Q2 as installed power fell 7%
ESS NEOFAB WEEKLY · No.04 · System
US energy storage is adding hours faster than it adds power.
Summary
The US installed a record 18.9 GWh of energy storage in the second quarter of 2026, yet installed power fell 7% from a year earlier. Duration, the energy divided by the power, got longer, and for utility-scale projects it reached 13,481 s (about 3.74 hours). If duration stretches to the 14,788 s average in the 2026–2031 outlook, a 10% rise in energy calls for only 0.3% more PCS capacity. Battery lines follow GWh and PCS-transformer lines follow GW, and each conversion unit carries a larger share as duration grows.
The market grew longer instead of stronger
Over the past year, US energy storage (ESS)1 added hours faster than it added power. In the second-quarter figures released this week, stored energy hit a quarterly record while installed power went down[1]. When I divided one number by the other, the gap traced back to duration2, the time a system can run at full output. That single number moves two kinds of factories at different speeds. One builds batteries. The other builds power conversion systems (PCS)3 and transformers4.
Headlines usually keep only the word “record”. Read that way, the battery plant, the PCS plant and the transformer plant all look equally busy. Yet batteries sell by how much energy they hold, while PCS units and transformers sell by how much power they can push out at once. That split set the question for this week. If you separate energy from power, whose workload changes, and by how much?
A school cafeteria makes the structure easy to see. Food in the pots is the stored energy. How many serving lines you open sets how fast plates go out, and that is the power. Divide the food by the serving rate and you get how long lunch service lasts; in storage, that figure is the duration. Make lunch twice as long and half the serving lines can hand out the same food.
This comparison breaks down in one place. A serving line only hands food out, while a PCS turns the battery’s direct current into the alternating current of the grid5 and runs the other way when charging. It also follows the grid’s frequency and voltage, so counting serving lines undersells what a PCS does. For sizing, though, the division still holds. This week supplied the numbers to put into it.
A record with a 7% drop attached
Wood Mackenzie’s quarterly US storage report, published on 23 September, sits at the center of those numbers. In the second quarter of 2026, the US installed 5.4 GW and 18.9 GWh6 of storage[1]. That was a record for energy. Power fell 7% from a year earlier. According to the report, longer-duration utility-scale and residential systems lifted the energy total.
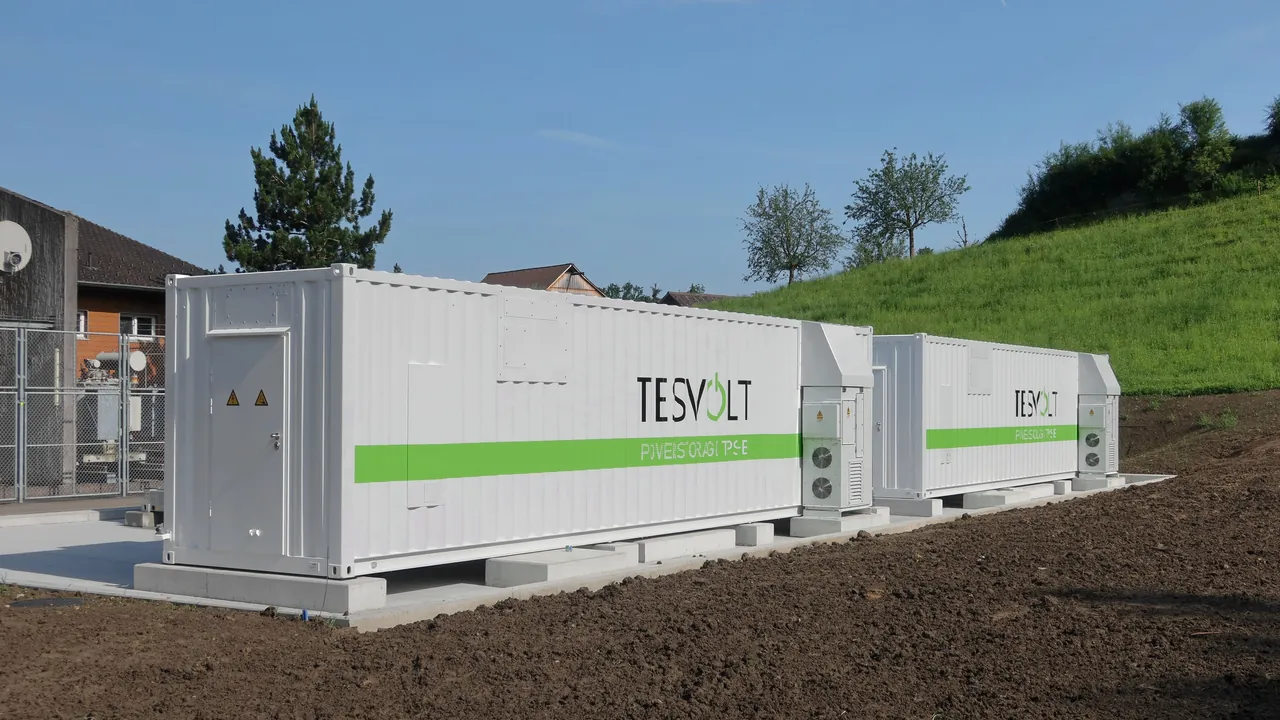
Large projects show the pattern more sharply. Utility-scale7 systems came to 4.7 GW and 17.6 GWh, with power down 8% year on year. Residential installations fell for a third straight quarter. Longer durations filled the space that lost power left behind, and energy set a record anyway.
In the news report, “record” and “down 7%” sit one paragraph apart. Read only the first, and you would assume orders rose for every piece of equipment on a storage site. Reading the second changes the picture. Counted in power, the quarter came in smaller than the same quarter last year, and power is the measure that PCS and transformer factories live by.
Another tally counts the same quarter differently. SEIA, the Solar Energy Industries Association, and Benchmark put it at 6.7 GW and 20.2 GWh[1]. I set the two reports side by side and worked out the gaps, which came to 24% in power and only 7% in energy. Public data does not say which tally is right.
So when reading storage news, I look at energy divided by power before the energy headline. Inside one report the two numbers moved in opposite directions. Between the two reports, the power gap ran more than three times the energy gap.
Widen the view to the world and regional designs split apart. Benchmark counted 20,855 MWh of grid-scale storage entering commercial operation8 worldwide in August[2]. In power terms, that is 6,516 MW. Europe added 914 MW with 2,290 MWh. Middle Eastern projects added 1,000 MW with 4,000 MWh. Projects that opened in the same month came out short and strong in Europe and long-running in the Middle East.
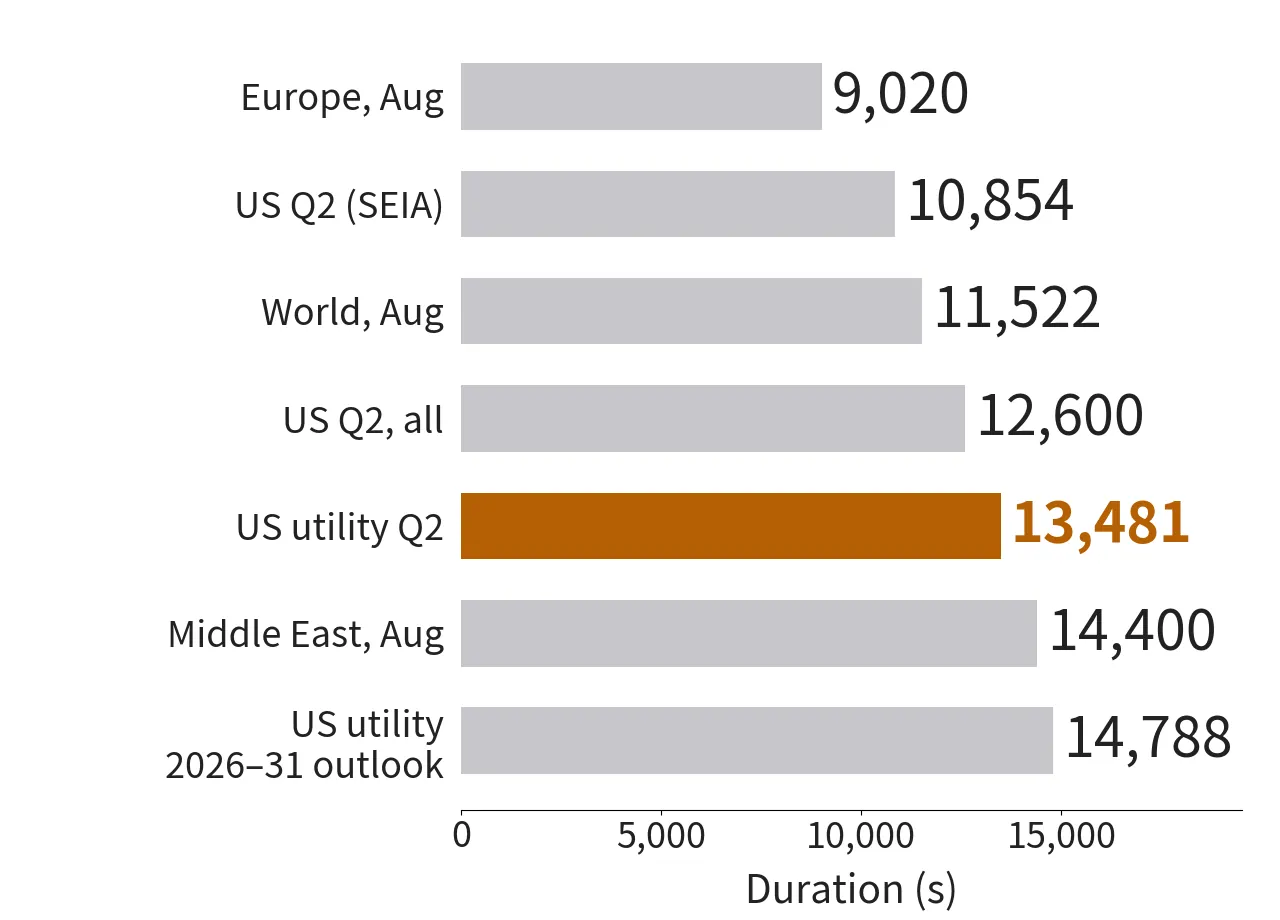
The chart lines up seven durations, each one the energy divided by the power quoted above. Europe’s 9,020 s (about 2.5 hours) is the shortest. At the other end sits the US utility-scale outlook at 14,788 s (about 4.1 hours), a gap of 1.64 times. For the same 1 GWh, a European-style design carries 1.64 times more PCS and transformer capacity.
One number sets the equipment count
Batteries trade in GWh, while PCS units and transformers trade in GW. To turn one quantity into the other, you divide or multiply by duration. At 7,200 s (2 hours), 1 GWh of batteries needs 500 MW of PCS, and at 14,400 s (4 hours) it needs 250 MW, half as much.
Real designs carry the same ratio. On 24 September, Greenvolt announced the start of construction on a 600 MW storage project in Siedlce, Poland[3]. It stores 2.4 GWh. Its design uses 210 battery containers and 105 transformer containers that house the PCS. At 14,400 s, two battery containers share one PCS-transformer container. Keep the container sizes, change only the duration, and the count for a 1 GWh project shifts.
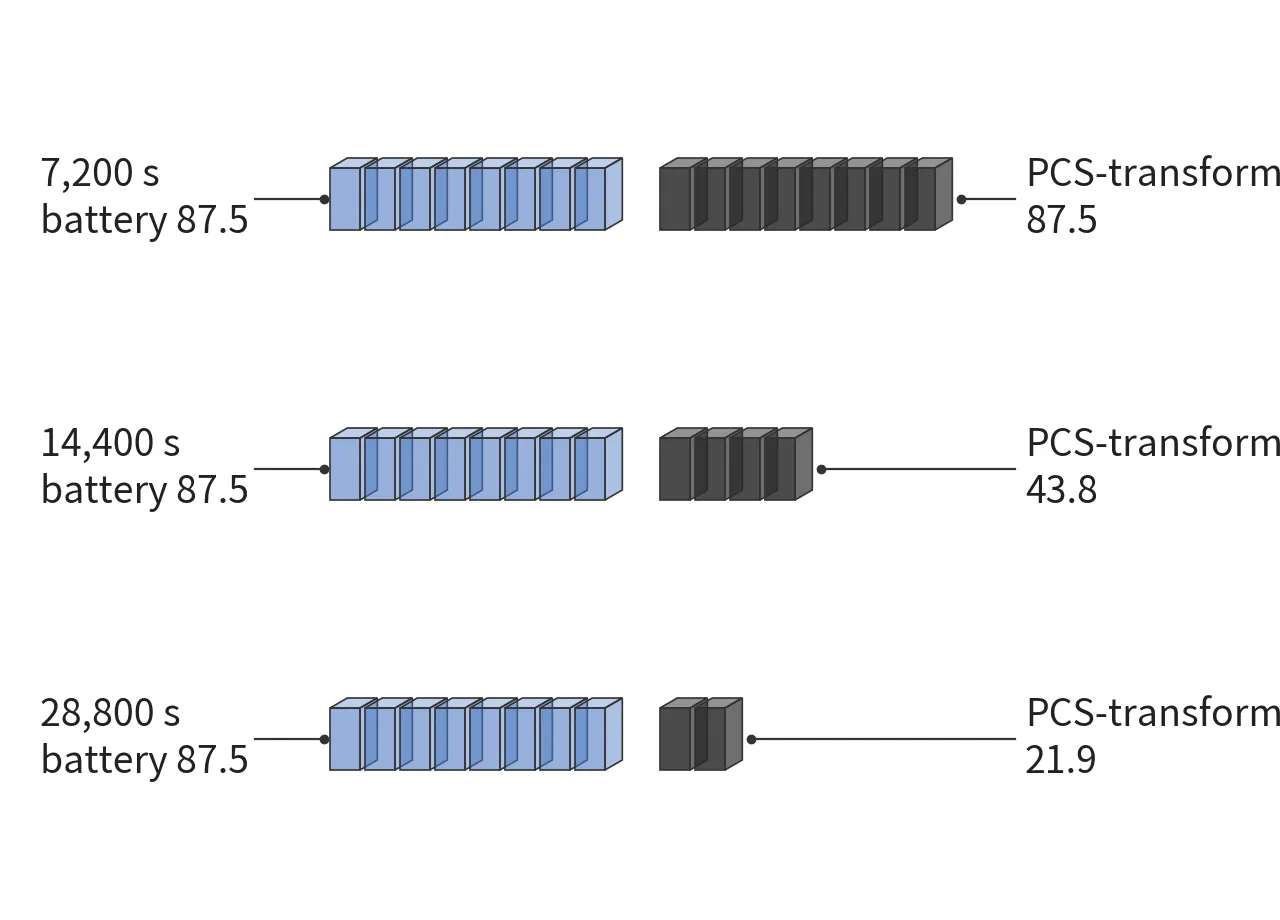
The diagram applies Siedlce’s average per-container figures to 1 GWh: 11.43 MWh per battery container and 5.71 MW per PCS-transformer container. Battery containers stay at 87.5 whatever the duration. Only the PCS side shrinks. Each doubling of duration halves the PCS-transformer containers, leaving 21.9 at 28,800 s (8 hours). I put the US second-quarter numbers and Wood Mackenzie’s outlook through the same division in the note.
Neofab’s calculation note
Duration (s) = energy (MWh) ÷ power (MW) × 3,600
US utility-scale, Q2 2026: 17,600 ÷ 4,700 × 3,600 = 13,481 s
US utility-scale outlook, 2026–2031: 534,000 ÷ 130,000 × 3,600 = 14,788 s
PCS power per 1 GWh (MW) = 1,000 × 3,600 ÷ duration (s)
13,481 s → 267 MW; 14,788 s → 243 MW (−8.8%)
PCS power needed when energy rises 10% = 1.10 × 13,481 ÷ 14,788 = 1.003 (+0.3%)
Assumptions: the duration of one quarter (Q2 2026) moves to the average duration of the cumulative 2026–2031 outlook. This math joins two numbers from different periods, and the inputs come from the Wood Mackenzie report.
PCS power per GWh falls from 267 MW to 243 MW. That is an 8.8% drop. While energy grows 10%, PCS power grows only 0.3%, so the PCS side barely keeps pace with the battery side. Because the math joins one quarter to a six-year average, I use it only to judge direction and rough size.
The ratio does not stop at the grid. Inside a factory that assembles storage systems, the same division ties the battery line to the PCS line.
The PCS line’s takt time stretches first
Assume an integrated plant that builds both battery containers and PCS-transformer containers. It ships 10 GWh a year, uses Siedlce-sized containers, and has 23,760,000 s of available working time (300 days of 22 hours). Takt time9 follows the fixed definition. Takt time = available working time / customer demand. The battery container line must deliver 875 units a year, which gives 27,154 s.
The PCS line works on a different beat. If the plant builds only 7,200 s products, this line also makes 875 units a year. Its takt time is then 27,154 s, in step with the battery line. Stretch the duration to the US second-quarter utility-scale average of 13,481 s and demand drops to 467 units. Takt time becomes 50,842 s.
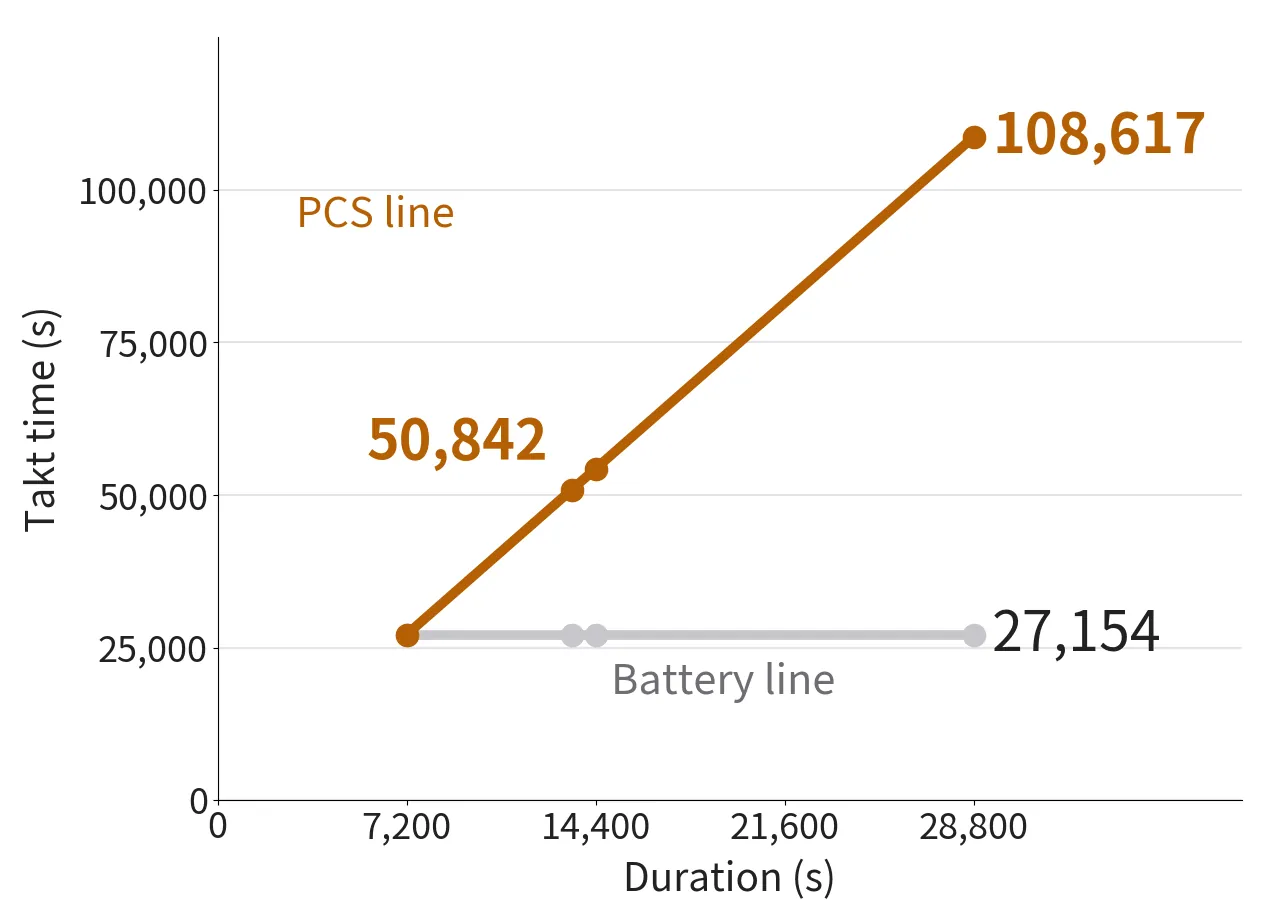
Both lines meet only at 7,200 s. To the right of that point, PCS takt time rises in proportion to duration and reaches 108,617 s for a 28,800 s (8-hour) product. Picture a plant that balanced both lines for 2-hour products. If it switches entirely to 13,481 s products, its PCS line runs at 53% load. Nearly half of it sits idle. In line balancing10 terms, the bottleneck stays on the battery line while slack builds up on the PCS line.
New factories face the same conversion. Spanish PCS maker Power Electronics held a groundbreaking ceremony for a factory in Houston on 24 September[4]. At full ramp, the company says the site can make 40 GW a year. It also makes solar inverters11 and products for data centers. I converted that 40 GW with the US utility-scale duration from earlier. If all of it went to storage, it would match about 150 GWh of batteries.
Even so, I do not think this announcement settles how US storage will source PCS at home. The 150 GWh figure assumes every gigawatt goes to storage, and the company has disclosed neither its initial capacity nor its product split nor a date for full output. An executive order signed on 26 August adds another variable. It starts a process to keep inverters, transformers and storage systems from suppliers tied to 24 sanctioned countries off the bulk power grid[5]. The Department of Energy has until 24 December to publish its rules.
The same news report describes a startup, Heron Power, that plans 40 GW a year and puts it at 10,000 units. At the 5 MW per unit that the report gives, the total comes to 50 GW. Those two numbers do not match. I could not tell which one holds, so I left that plan out of the math. The spare capacity on the PCS line has a flip side, too. With fewer conversion units in the field, what happens when one of them stops?
Batteries follow GWh, conversion gear follows GW
Australia’s Waratah Super Battery shows one side of the answer. The 850 MW system reached full commercial operation on 28 September[6]. In October 2025 one of its high-voltage transformers failed badly, and the operator took a second one offline as a precaution, so the plant ran at only 350 MW for most of its commissioning. The fault sat in a transformer, not in the batteries. Contracted revenue in that period still came to roughly half of what the owner expected.
Specialized transformers from overseas usually take 12 to 18 months to arrive, a long lead time12. Waratah’s replacement came from an Australian manufacturer. Output returned to 700 MW only in June 2026, when the precautionary unit came back. One transformer failure held contracted revenue at half for about eight months.
Longer durations mean fewer conversion units for the same energy. Each unit’s share grows in turn. I laid out the count and the share per unit in a table, assuming a 1 GWh project built with Siedlce-sized containers.
| Duration (s) | Battery containers | PCS-transformer containers | Share of one unit (%) |
|---|---|---|---|
| 7,200 | 87.5 | 87.5 | 1.14 |
| 13,481 | 87.5 | 46.7 | 2.14 |
| 14,400 | 87.5 | 43.8 | 2.29 |
| 28,800 | 87.5 | 21.9 | 4.57 |
When duration doubles from 7,200 s to 14,400 s, the share carried by one unit doubles as well. In the table it climbs from 1.14% to 2.29%. My judgment is that as durations grow, spare parts and procurement time for conversion equipment deserve the same scrutiny as the batteries themselves. Waratah’s eight months showed that weight first.
This calculation rests on several assumptions. It applies Siedlce’s container sizes to every project, and the integrated plant’s 10 GWh a year and its working time are assumed inputs. Duration itself shifts with the counting method, as the two reports show. PCS demand also comes from solar and data centers, so storage duration alone cannot predict a PCS maker’s results.
Battery factories gain work in step with GWh, while PCS and transformer factories gain work in step with GW, and more slowly. In exchange, each conversion unit carries more stored energy as duration grows. When the next quarterly report comes out, I will look for the utility-scale duration before the word “record”. This quarter’s value is 13,481 s (about 3.74 hours).
Frequently asked questions
Do PCS makers lose work when duration grows?
They need less power per GWh, yes. Yet Wood Mackenzie expects US storage installations to grow more than 50% in power terms over the next five years[1]. What shrinks is the share per GWh, while total demand still grows in power terms. PCS makers also sell into solar and data centers.
Wood Mackenzie and SEIA disagree, so which one is right?
Public data cannot settle which is more accurate. Their figures differ by 24% in power and 7% in energy. If you mix the two sources to compute a year-on-year change, the difference in method turns into a fake change. I would pick one source and track it the same way every quarter.
What each reader can do
The same division serves different purposes depending on where you sit.
| Reader | What to take away | What to try now |
|---|---|---|
| Job seeker | Battery lines take orders in GWh, while PCS and transformer lines take them in GW | Check whether a target company reports capacity in GWh or GW, then convert between the two with 13,481 s |
| General reader | Dividing the two numbers in a storage story tells you how many hours the system lasts | Try it on the next storage story, the way 2,400 MWh ÷ 600 MW × 3,600 = 14,400 s works for Siedlce |
| Reader interested in investing | On the outlook-based math, a 10% rise in energy may need only 0.3% more PCS power | Record utility-scale GWh ÷ GW from every quarterly report and note how far it moves from 13,481 s |
This article is for information only and is not investment advice. See our Disclaimer.
Glossary
- Energy storage system (ESS) — Equipment that stores electricity in batteries and releases it when needed. Here it means large battery storage connected to the grid. ↩
- Duration — The time a storage system can deliver electricity at full output without stopping. It equals energy (MWh) divided by power (MW); this piece writes it in s. ↩
- Power conversion system (PCS) — The device that converts between the battery’s direct current and the grid’s alternating current. It moves power in both directions, and its size is stated as the power (MW) it can move at once. ↩
- Transformer — Equipment that raises or lowers voltage. In a storage site it steps up the PCS output to grid voltage. ↩
- Grid — The transmission and distribution network that carries electricity from power plants to users. ↩
- GW and GWh (gigawatt, gigawatt-hour) — GW measures power at a given moment, and GWh measures the energy that power delivers over time. Running 1 GW for 3,600 s delivers 1 GWh. ↩
- Utility-scale — Large systems that utilities or power producers connect directly to the grid, as opposed to residential or commercial systems. ↩
- Commercial operation (COD, commercial operation date) — The point at which a plant finishes commissioning and starts selling power, or the date of that point. ↩
- Takt time — How often a line must finish one unit to keep up with customer demand. Takt time = available working time / customer demand. More: how to calculate takt time ↩
- Line balancing — Dividing work and equipment so that lines or processes run at a similar beat. The slowest one sets the overall speed. ↩
- Inverter — A device that turns direct current into alternating current. Solar plants use inverters to feed panel output into the grid, and a storage PCS works on the same principle. ↩
- Lead time — The time between placing an order and receiving the goods. Built-to-order equipment such as large transformers has long lead times. ↩
Sources and notes
- Energy-Storage.News, “Data centre buildout uplifting US BESS market outlook, Wood Mackenzie says”, 24 September 2026. Covers the Wood Mackenzie Q3 2026 US Energy Storage Monitor (released 23 September) and the SEIA and Benchmark Q2 figures. https://www.energy-storage.news/data-centre-buildout-uplifting-us-bess-market-outlook-wood-mackenzie-says/
- Energy-Storage.News, “21GWh BESS deployed globally in August: One-fifth in Saudi Arabia, European activity soars”, 22 September 2026. Figures from Benchmark Mineral Intelligence. https://www.energy-storage.news/21gwh-bess-deployed-globally-august-one-fifth-saudi-arabia-european-activity-soars/
- Greenvolt, “Greenvolt begins Construction of One of Europe’s Largest Battery Energy Storage Projects”, 24 September 2026. https://greenvolt.com/greenvolt-begins-construction-of-one-of-europes-largest-battery-energy-storage-projects/
- Energy-Storage.News, “US power conversion manufacturers in spotlight: Power Electronics builds Houston factory, Heron Power lands RWE pilot”, 25 September 2026. https://www.energy-storage.news/us-power-conversion-manufacturers-in-spotlight-power-electronics-builds-houston-factory-heron-power-lands-rwe-pilot/
- pv magazine USA, “Executive order bans foreign-produced transformers, inverters, and circuit breakers for U.S. power grid”, 27 August 2026. Source for the order’s scope and the Department of Energy deadline. https://pv-magazine-usa.com/2026/08/27/executive-order-bans-foreign-produced-transformers-inverters-and-circuit-breakers-for-u-s-power-grid/
- Energy-Storage.News, “Australia’s most powerful battery storage system officially completed”, 28 September 2026. https://www.energy-storage.news/australias-most-powerful-battery-storage-system-officially-completed/
- Assumed values: the Siedlce per-container averages (11.43 MWh per battery container, 5.71 MW per PCS-transformer container) come from dividing 2,400 MWh and 600 MW by the container counts, and the 1 GWh and integrated-plant calculations reuse them. Real projects use different container sizes. The integrated plant’s 10 GWh a year and its 23,760,000 s of available working time (300 days of 22 hours) are inputs chosen to show the takt time calculation.
- All durations divide published energy by published power and express the result in s. Wood Mackenzie’s power change compares the same quarter a year earlier, and the 2026–2031 value divides the cumulative outlook as published, so it covers a different period from a single quarter. The gaps between the two reports (24% in power, 7% in energy) divide the SEIA and Benchmark values by the Wood Mackenzie values. Waratah’s eight months run from the October 2025 failure to the June 2026 return to 700 MW.
- Photo: Kecko from Eastern Switzerland, “Tesvolt battery energy storage system Rheineck”, CC BY 2.0, Wikimedia Commons. https://commons.wikimedia.org/wiki/File:Tesvolt_battery_energy_storage_system_Rheineck.jpg


You May Also Like

Embedding an AI Vision Inspection Gate in the Line: Redefining OEE and Takt-Time Design Variables

Introducing Robotic Automation Equipment — Where Does the Interface with Line Takt Time Break Down