본문으로 바로가기
Ess-neofab

A line- and system-level record of ESS and secondary-battery manufacturing processes

  • 한국어
  • English
  • Home
  • Process
  • System
  • Interface
  • Traceability
  • News & Trends
  • About
  • Contact
  • 한국어
  • English
  • Home
  • Process
  • System
  • Interface
  • Traceability
  • News & Trends
  • About
  • Contact

카테고리

  • Interface (28)
  • News & Trends (20)
  • Process (32)
  • System (31)
  • Traceability (22)

최근 글

  • Five million ACC cells equal 2.7 to 3.6 months of nameplate outputOctober 15, 2026
  • A 160 MW battery’s six-week commissioning has two baselinesOctober 8, 2026
  • Two Cycles a Day Take 106.8 % of a Day, and the Retention Tier Shifts Cell Volume by 1.47 GWhOctober 1, 2026
  • Battwoo’s Second-Life EV Batteries — When an 80 % Acceptance Threshold Overlaps the Retirement Distribution, Incoming Screening Becomes the BottleneckSeptember 30, 2026
  • US storage set an energy record in Q2 as installed power fell 7%September 29, 2026
  • CATL Starts Trial Production in Debrecen — The Digits of the Defect-Rate Target, Not the Equipment, Set the Length of a Trial RunSeptember 29, 2026
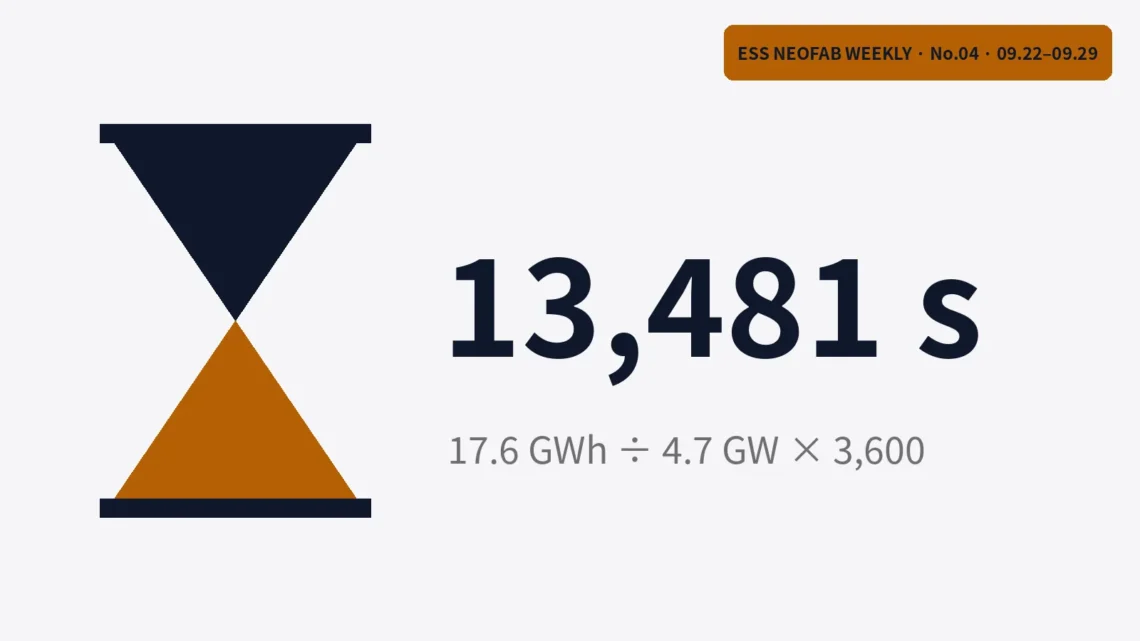
  • Hourglass graphic with the Q2 2026 US utility-scale storage duration of 13,481 s and its formula
    Process,  System

    US storage set an energy record in Q2 as installed power fell 7%

    September 29, 2026 /

    The US installed a record 18.9 GWh of energy storage in the second quarter of 2026, yet installed power fell 7% from a year earlier. Duration, the energy divided by the power, got longer, and for utility-scale projects it reached 13,481 s (about 3.74 hours). If duration stretches to the 14,788 s average in the 2026–2031 outlook, a 10% rise in energy calls for only 0.3% more PCS capacity. Battery lines follow GWh and PCS-transformer lines follow GW, and each conversion unit carries a larger share as duration grows.
    read more
    ESS-neofab 0 Comments

    You May Also Like

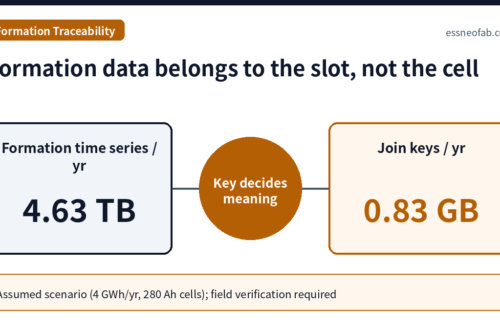
    Formation data belongs to the slot, not the cell

    Linking Cell History in Formation and Aging: History Contamination from Tray ID + Slot Mapping

    July 11, 2026
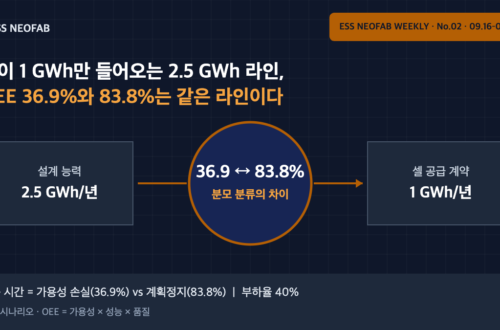
    설계 능력 2.5 GWh와 셀 공급 1 GWh 조건에서 OEE가 36.9% 또는 83.8%로 보고되는 분모 분류 차이 도식

    A 2.5 GWh Line Fed Only 1 GWh of Cells — OEE of 36.9% and 83.8% Describe the Same Line

    September 25, 2026
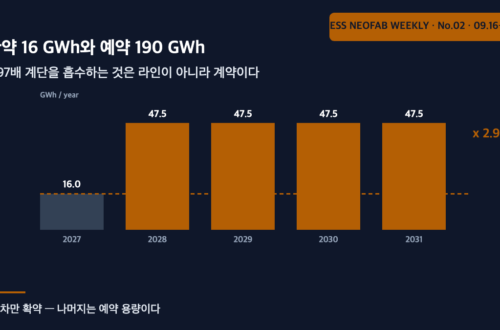
    EVE–Fluence 206 GWh 계약의 연도별 물량 계단 그래프 — 2027년 16 GWh에서 2028년 이후 47.5 GWh로 2.97배 뛰는 구조

    16 GWh committed and 190 GWh reserved — what absorbs the 2.97x step is the contract, not the line

    September 27, 2026
© 2026 Ess-neofab · A line- and system-level record of ESS and secondary-battery manufacturing processes
  • About
  • Contact
  • Privacy Policy
  • Disclaimer
Ashe Theme by WP Royal.