CATL Starts Trial Production in Debrecen — The Digits of the Defect-Rate Target, Not the Equipment, Set the Length of a Trial Run
Abstract
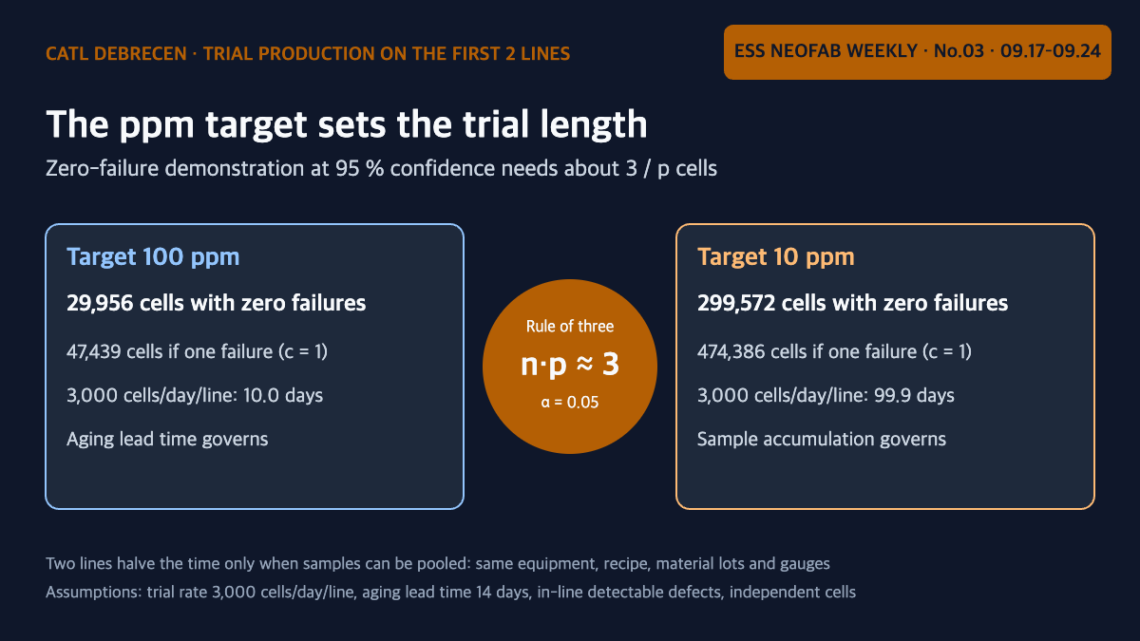
On September 22, 2026, CATL started trial production on the first two production lines of its cell plant in Debrecen, Hungary, stating that the purpose is “to set up, optimise and validate the production equipment and manufacturing processes ahead of series production”¹. If validation is defined as demonstrating a defect rate, a zero-failure demonstration at 95 % confidence requires 29,956 cells for 100 ppm and 299,572 cells for 10 ppm. Compared with an assumed aging-judgment lead time of 14 days, aging governs the trial length at a 100 ppm target, while sample accumulation governs it at 10 ppm. The second line halves the time only when samples are pooled, and because zero-failure data cannot prove equivalence between lines, the basis for pooling must be records of identical equipment, recipes and material lots rather than the results themselves.
1. Conclusion First — The Number of Digits in the ppm Target Sets the Trial Length
What determines the length of a trial production run is not how fast equipment is tuned but “how many ppm you intend to demonstrate.” Each digit you drop from the target defect rate multiplies the required sample tenfold and moves the bottleneck from aging judgment to sample accumulation. Adding a second line does not shorten the trial unless there is a basis for pooling samples.
Situation (S): CATL announced the Debrecen plant in August 2022, started the first cell building in summer 2023, equipped it by spring 2026, obtained the occupancy permit in August 2026, fulfilled the preconditions of its IPPC permit and started the first two lines on September 22¹. Complication (C): trial production aims at “validation,” but what must be demonstrated, at what confidence, for it to end is not disclosed. Question (Q): which variables set the minimum length of a trial run? Answer (A): the ppm target, the number of allowed failures, the aging lead time and whether samples can be pooled across lines.
| Item | Published content | Use in this article |
|---|---|---|
| Start of trial production | 2026-09-22, first two production lines of the cell plant | Reference event |
| Purpose of the trial | Set up, optimise and validate production equipment and processes before series production | Object of a quantitative definition of “validation” |
| Planned capacity | 100 GWh once all facilities are ready (CATL’s largest base outside China) | Context for later line expansion |
| Existing operation | Module production since autumn 2024, 537,000 modules to date | Reference (not used in calculation) |
| Permits | Occupancy permit in August 2026, IPPC permit preconditions fulfilled | Reference |
2. Mechanism — A Zero-Failure Demonstration Needs About 3/p Samples
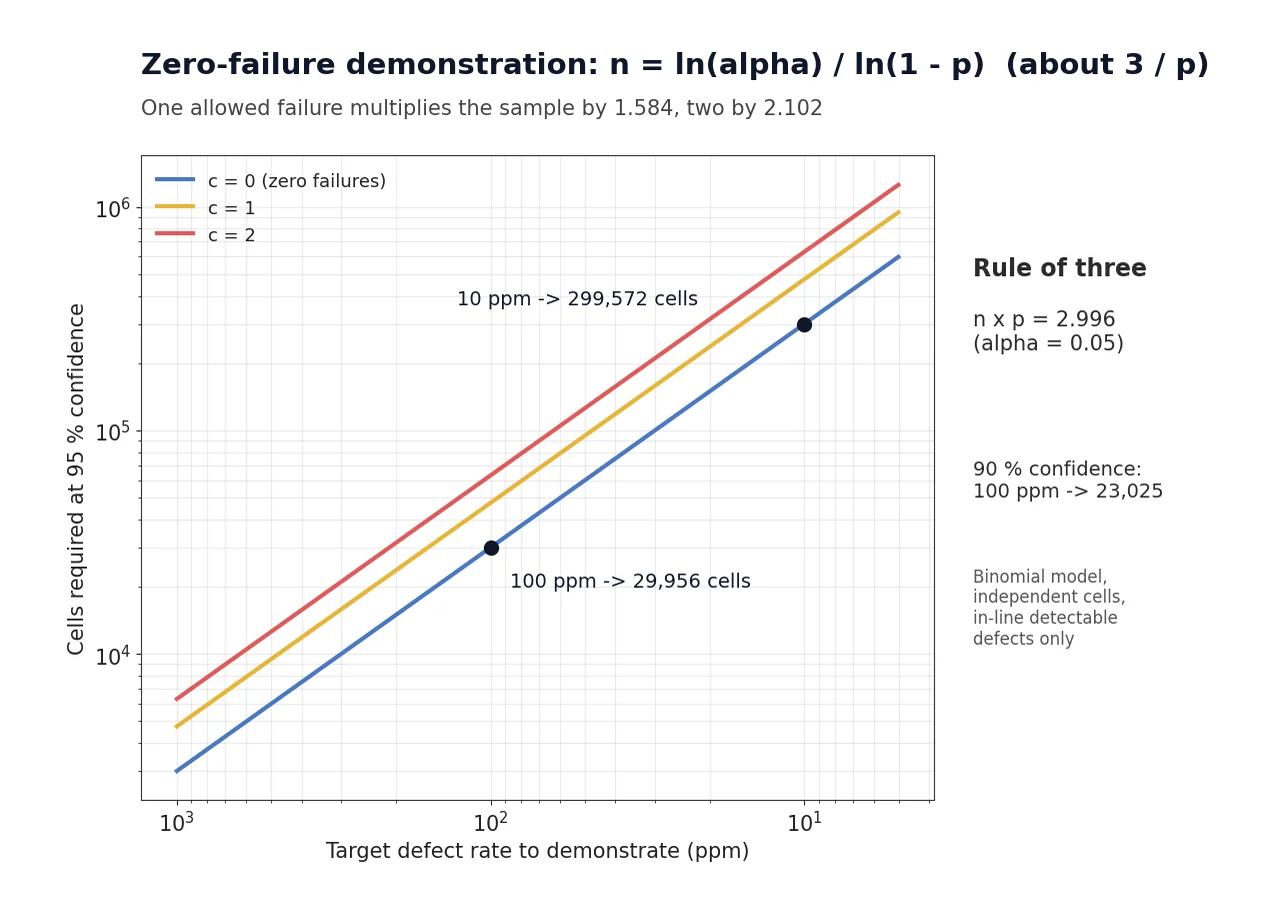
To demonstrate at confidence 1−α that the defect rate is at most p, n units must pass with zero failures. From the binomial distribution, (1−p)ⁿ ≤ α, so n = ln α / ln(1−p); at 95 % confidence n ≈ 2.996/p, the so-called “rule of three.” If up to c failures are allowed, n = χ²(0.95; 2c+2)/(2p), which is 1.584 times larger for c = 1 and 2.102 times larger for c = 2.
| Target defect rate | Zero failures (c = 0) | One allowed (c = 1) | Two allowed (c = 2) |
|---|---|---|---|
| 500 ppm | 5,990 cells | 9,488 cells | 12,592 cells |
| 200 ppm | 14,978 cells | 23,719 cells | 31,479 cells |
| 100 ppm | 29,956 cells | 47,439 cells | 62,958 cells |
| 50 ppm | 59,914 cells | 94,877 cells | 125,916 cells |
| 10 ppm | 299,572 cells | 474,386 cells | 629,579 cells |
※ Calculation conditions: 95 % confidence (at 90 %, the zero-failure sample for 100 ppm is 23,025 cells), independent defects between cells (binomial), and only defects detectable by in-line final inspection. Implication: because the sample size is inversely proportional to the target p rather than to anything about the equipment, a trial plan that does not first state a ppm target has no exit criterion.
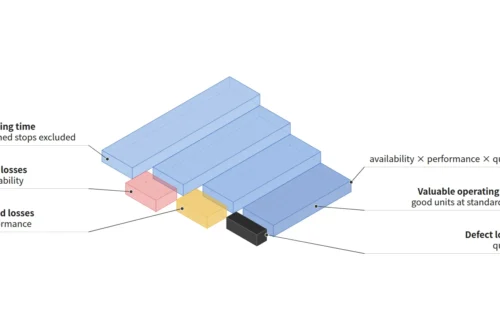
This value also links to the resolution of the quality term of OEE (= availability × performance × quality). What 29,956 zero-failure cells tell you is that “there is a 95 % chance that the quality term is at least 99.99 %,” and quality levels finer than that cannot be distinguished with this sample.
3. Calculation — Whichever Is Longer, Aging Lead Time or Sample Accumulation, Sets the Length
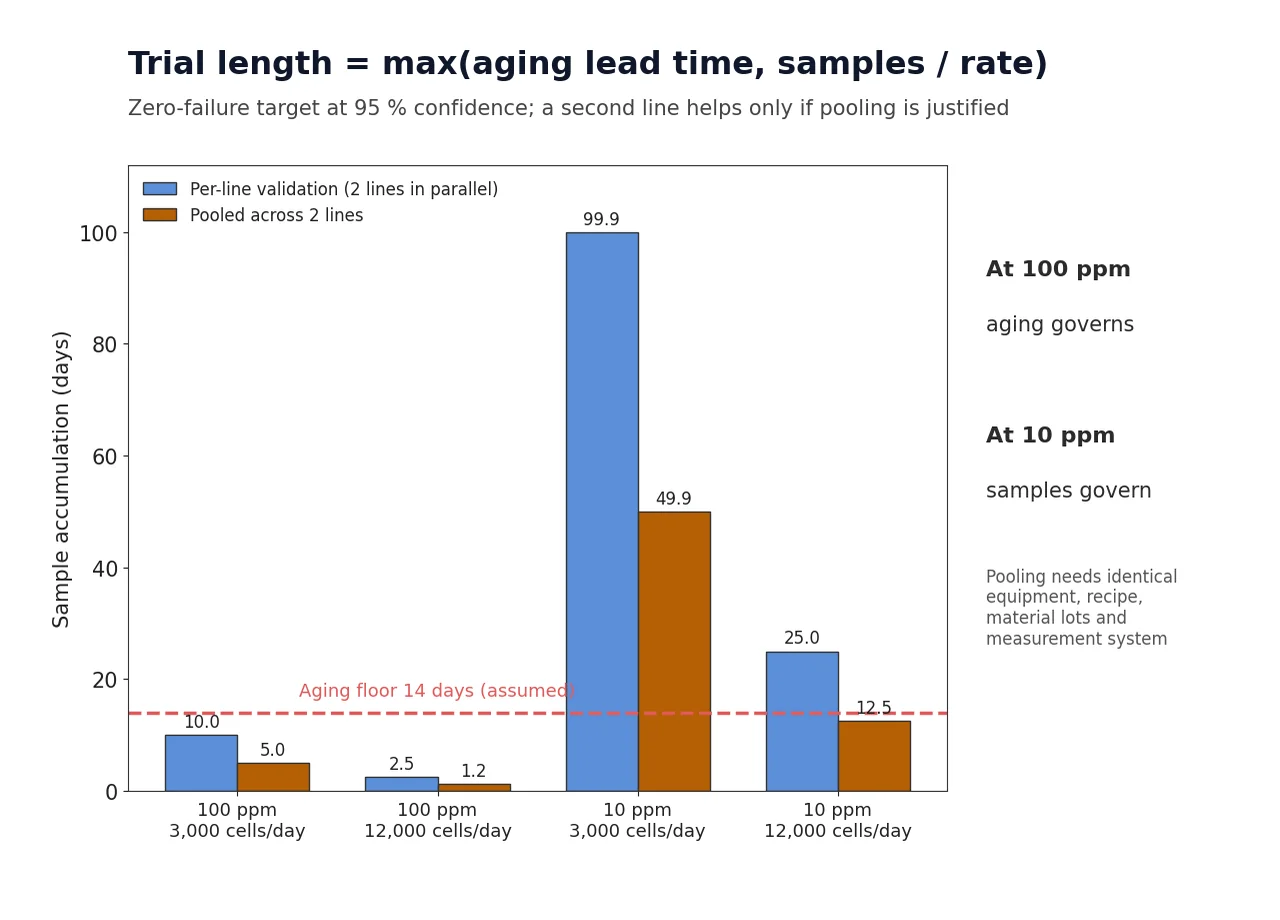
Trial output was assumed to be either 3,000 or 12,000 cells per line per day, and the post-formation aging and self-discharge judgment lead time was assumed to be 14 days (1,209,600 s). The minimum length is the longer of “sample accumulation time” and “aging lead time,” plus any tuning iterations. If two lines are validated separately, each line must fill its own sample, so the length is the same as for a single line.
| Target / output per line | Sample accumulation (per-line validation) | Sample accumulation (two lines pooled) | Governing factor (vs 14-day aging) |
|---|---|---|---|
| 100 ppm / 3,000 cells per day | 10.0 days | 5.0 days | Aging lead time |
| 100 ppm / 12,000 cells per day | 2.5 days | 1.2 days | Aging lead time |
| 10 ppm / 3,000 cells per day | 99.9 days | 49.9 days | Sample accumulation |
| 10 ppm / 12,000 cells per day | 25.0 days | 12.5 days | Aging if pooled, samples if per line |
※ Calculation conditions: trial output, aging lead time and ppm target are all assumptions (not disclosed by CATL), zero-failure criterion, zero tuning iterations. The baseline is “per-line validation,” and pooling holds only when the conditions in Section 4 are met.
The table shows two things. At a 100 ppm target the aging lead time sets the length at every output rate, so raising line speed does not shorten the trial. At a 10 ppm target sample accumulation dominates, and only then do the second line and sample pooling become real variables that can halve the length.
4. Line and Data Perspective — The Basis for Pooling Is a Record of Process Identity, Not the Results
Even if pooling the two lines demonstrates 100 ppm for the plant as a whole, each line contributed 14,978 cells, so each line individually has only demonstrated 200 ppm. If both lines show zero failures, the result data cannot distinguish a case where one line runs at 30 ppm and the other at 150 ppm. In other words, zero-failure data offer no way to demonstrate equivalence between lines.
The basis for pooling must therefore be the identity of process conditions, i.e., records showing that equipment specifications, recipe versions, material lots and measurement systems are the same. That judgment is possible only when traceability data link each cell ID to its line, equipment, recipe and material lot. When defects cluster by lot, the effective sample shrinks; with a design effect of 2, the zero-failure sample for 100 ppm doubles to 59,914 cells.
Judging weld quality through in-production sampling with variance and mean tests (CN103376278A)² and detecting quality problems early through in-line analysis of process signals (US20210365009A1)³ are known as general prior art. Neither patent corresponds one-to-one to this trial run.
This article sits on a different layer from #354 (the early quality-term bottleneck in an ESS-LFP production changeover) and #295 (the blended-OEE illusion created by sequential commissioning). Where those articles dealt with how indicators move during ramp-up, this article deals with the sample size needed for the decision to move into series production and the conditions for pooling it.
5. Conclusion and Limitations
The minimum length of trial production is max(aging lead time, target sample ÷ sample accumulation rate), and the target sample of about 3/p is set by the ppm target. Additional lines shorten validation only when sample pooling is justified, and that justification can come only from records of process identity, not from zero-failure results. The first line of a trial production plan should therefore be the ppm target and the confidence level, not the equipment schedule.
As a limitation, this model covers only defects detectable by in-line inspection; latent defects that surface in the field require separate reliability testing. CATL’s actual ppm targets, trial output and judgment criteria have not been disclosed, so the durations above are assumed scenarios that require further verification.
FAQ
Q1. What happens if one defect appears during trial production?
Recalculating with c = 1 raises the sample needed to demonstrate 100 ppm from 29,956 to 47,439 cells, an increase of 58.4 %. Samples already accumulated still count, but the exit criterion moves later. If the cause was removed by tuning, the rule for whether units after that point count as a new sample should be agreed in advance.
Q2. Wouldn’t demonstrating with the process capability index (Cpk) need far fewer samples?
Yes. For variables characteristics measured as continuous values, such as capacity, OCV and self-discharge rate, an observed Cpk of 1.50 over 125 cells gives a 95 % lower bound of 1.336, enough to claim Cpk ≥ 1.33, which corresponds to a one-sided 33 ppm under a normal distribution. However, whether normality holds in the tails is uncertain, and attribute defects that do not show up as continuous values, such as foreign particles and micro-shorts, still follow the 3/p rule, so the two should be planned separately.
Q3. Isn’t validation easier for a plant that has already built 537,000 modules?
The history of the module process does not demonstrate the defect rate of the cell process. A different process needs a different sample; module-line experience only helps bring forward the measurement systems and data-linkage infrastructure.
Field Application Notes
| Check | How to execute | Decision criterion | Remarks |
|---|---|---|---|
| ☐ State the ppm target and confidence level | Write the target ppm, confidence level and allowed failures c for each characteristic on the first page of the trial plan | Is the exit criterion defined numerically? | Assumed example: 100 ppm, 95 %, c = 0 |
| ☐ Separate attribute and variables characteristics | Plan continuous characteristics with Cpk and pass/fail characteristics with zero-failure samples | One judgment method assigned per characteristic | Normality to be checked |
| ☐ Pooling-condition checklist | Record identity of equipment specifications, recipe versions, material lots and measurement systems between lines | Pool only when all four items match | Cell ID linkage required |
| ☐ Recalculation rule when a defect occurs | Agree in advance on sample recalculation when c increases and on separating samples before and after tuning | Is the rule documented? | No after-the-fact interpretation |
| ☐ State the aging lead time | Mark the aging and judgment lead time (s) as the lower bound of the schedule | Compute max(aging, sample accumulation) | Assumed 14 days |
Sources and Notes
¹ CATL, “CATL kicks off trial production of battery cells in Hungary,” PR Newswire, 2026-09-22. Start date, first two lines, purpose (set up, optimise, validate), 100 GWh, 537,000 modules and permitting history are cited.
² CN103376278A, “Method for detecting welding firmness of lithium ion battery tab,” GCL Power New Materials (Yancheng), published 2013-10-30 (patents.google.com). Cited as general prior art.
³ US20210365009A1, “Battery manufacturing processes based on acoustic and process signal analysis,” Feasible Inc, published 2021-11-25 (patents.google.com). Cited as general prior art.
※ Patent search: no new patents were found in the most recent 7 days by publication date, so the search was widened to 30 days, still with no new relevant patents.
※ Terms: a zero-failure demonstration is an attribute judgment that shows the defect rate is at or below the target with zero defects; the design effect is the factor by which lot clustering shrinks the effective sample. The ppm target, trial output and aging lead time are assumed scenarios and require verification against measured data.
Other Articles in This Issue
- Pylontech’s 588 Ah and 601 Ah LFP Cells Enter Mass Production — Why Energy-Weighted Availability Stays the Same When the Cell Count Halves
- Battwoo’s Second-Life EV Batteries — When an 80 % Acceptance Threshold Overlaps the Retirement Distribution, Incoming Screening Becomes the Bottleneck


You May Also Like
Two Cycles a Day Take 106.8 % of a Day, and the Retention Tier Shifts Cell Volume by 1.47 GWh
Cell Grading Bin Count and Grade-Specific WIP: What Module Matching History Must Retain