The Equipment Maker’s Line-Ownership Shift — OEE and Takt-Time Design During the ESS-LFP New-Line Mass-Production Ramp-Up
Abstract
As more equipment suppliers directly operate their own ESS-LFP lines, a need has emerged to review line balancing and OEE management during the mass-production ramp-up separately from equipment-buyer-owned lines. Prompted by domestic equipment maker PNT’s May 2026 earnings announcement, in which it stated it is focusing on yield stabilization for its Plant 4 ESS-LFP battery/cathode-active-material production line with a target of mass-production conversion in the second half of 2026, this article designs and verifies a target scenario for the order in which the three OEE factors — Availability, Performance, and Quality — improve during a ramp-up phase in which both new materials and a new line are introduced simultaneously.
It also notes, as a system-interface-level snapshot, the trend in which the enforcement of the solid-state national standard GB/T 43568-2026 requires re-assessment of existing line equipment assets, alongside changes in ESS grid-interconnection methods in Australia and the US. The OEE and takt-time figures presented in this article are not published measured values but a target scenario back-calculated from a line-engineering perspective, and require separate verification against actual mass-production-line values.
1. In ESS-LFP Line Ramp-Up, the Bottleneck Starts Not with Equipment, but with the Quality Factor
To state the conclusion first, in a structure where the equipment maker directly owns the line, OEE loss during the initial yield-stabilization phase has been repeatedly observed to occur first in the Quality factor rather than in equipment operating reliability (Availability). This is because, while an equipment supplier that directly operates the line can manage the equipment’s own failure history and maintenance cycle with already-secured data, simultaneously internalizing a new cathode active material creates a separate variable of material-property variation with an undetermined process window.
S (Situation): In its Q1 2026 earnings disclosed on May 13, 2026, PNT reported revenue of KRW 101.4 billion and operating profit of KRW 8.79 billion, and disclosed plans to focus on yield stabilization for the ESS-LFP battery and cathode-active-material production line at Plant 4, which it is pursuing as a new growth business, aiming to shift to a mass-production regime in the second half of 2026. At the CIBF 2026 exhibition in Shenzhen, China, held the same month, it also showcased dry-electrode equipment and solid-state battery production facilities.
C (Complication): A structure in which an equipment specialist directly operates its own ESS-LFP line has the advantage of holding equipment-reliability data in-house, but simultaneously internalizing the cathode active material increases the number of process variables, so the initial OEE-improvement path can differ from that of a typical ‘equipment-buyer’ line. In particular, when active-material production and electrode coating are vertically linked within a single line, there is an interface risk in which upstream particle-size-distribution and moisture-content variation transfers directly into a downstream line-speed (m/min) reduction in the coating process.
Q (Question): In this case, which of Availability, Performance, or Quality should the line engineer prioritize managing?
A (Answer): The actual loss structure of PNT’s line cannot be specified from public information alone. However, back-calculating a target scenario based on the general pattern of similar cases where new materials and a new line are introduced simultaneously, this article judges that quality-loss management is more likely than availability loss to be the primary bottleneck during the initial 6-month ramp-up window. This is a hypothetical conclusion requiring separate verification, and is made concrete in the scenario table in Section 3.
2. Line-Balancing Structure — The New Interface Created by Internalizing Active-Material Production
A typical equipment-buyer line receives cathode active material externally with a fixed spec, and designs line balancing starting from the electrode-coating process. A line that also internalizes active-material production, however, must absorb the variability of the furthest-upstream process as-is within a 5-stage structure of ‘active-material production → electrode coating → assembly → formation → pack,’ so it is safer to place a separate inventory buffer between active-material production and coating, and to operate a physical-property inspection as an interface gate.
| Process Stage | Target Line Speed | Buffer Location | Key Interface Risk |
|---|---|---|---|
| Cathode active-material production | Batch-basis, managed as throughput per lot | Active-material silo (several hours’ worth) | Particle-size-distribution and moisture-content variation transfers directly downstream |
| Electrode coating | Target 20–35 m/min (upward target after composition stabilizes) | Tension buffer between coating and drying | Coating-thickness deviation from active-material viscosity variation |
| Drying oven | Target hot-air flow rate 120–180 m³/min, per-zone 80–130 °C | – | Frequency of drying-profile readjustment due to moisture-content deviation |
| Assembly/formation | Target takt time 8–12 s/cell (assembly basis) | Pre-formation staging buffer | Time lag by which coating-thickness deviation transfers into the formation reject rate |
The figures in the table are target values presented for design-review purposes, referencing the general operating range of similar LFP lines, and cannot be taken as PNT’s Plant 4 measured specifications. They must be re-verified against actual line commissioning data.
Measurement-condition note: assumes 3-shift 24-hour operation, 600 h/month of operating time, no sample (target scenario, not measured).
3. Decomposing the Three OEE Factors — Target Scenario for the 6-Month Ramp-Up Window
OEE is defined as Availability × Performance × Quality, and takt time is Available Operating Time divided by Customer Required Quantity (not to be conflated with cycle time or FPY). Dividing the 6 months from immediately after new-line commissioning to mass-production conversion into 3 windows and back-calculating a target scenario yields the following.
| Window | Availability Target | Performance Target | Quality Target | OEE Target | Primary Loss Factor (Hypothesis) |
|---|---|---|---|---|---|
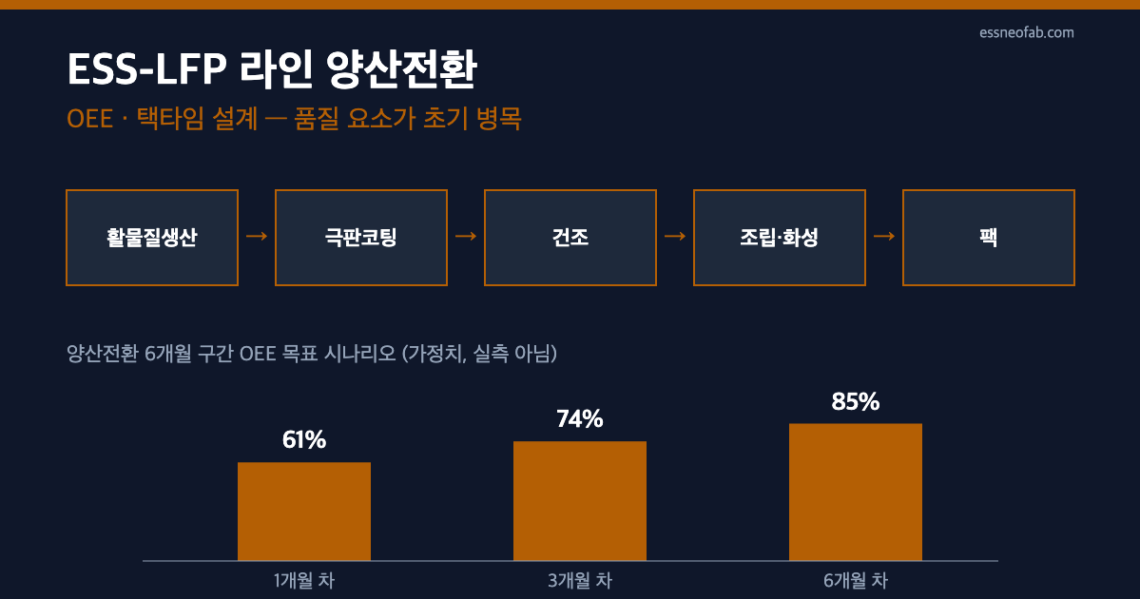
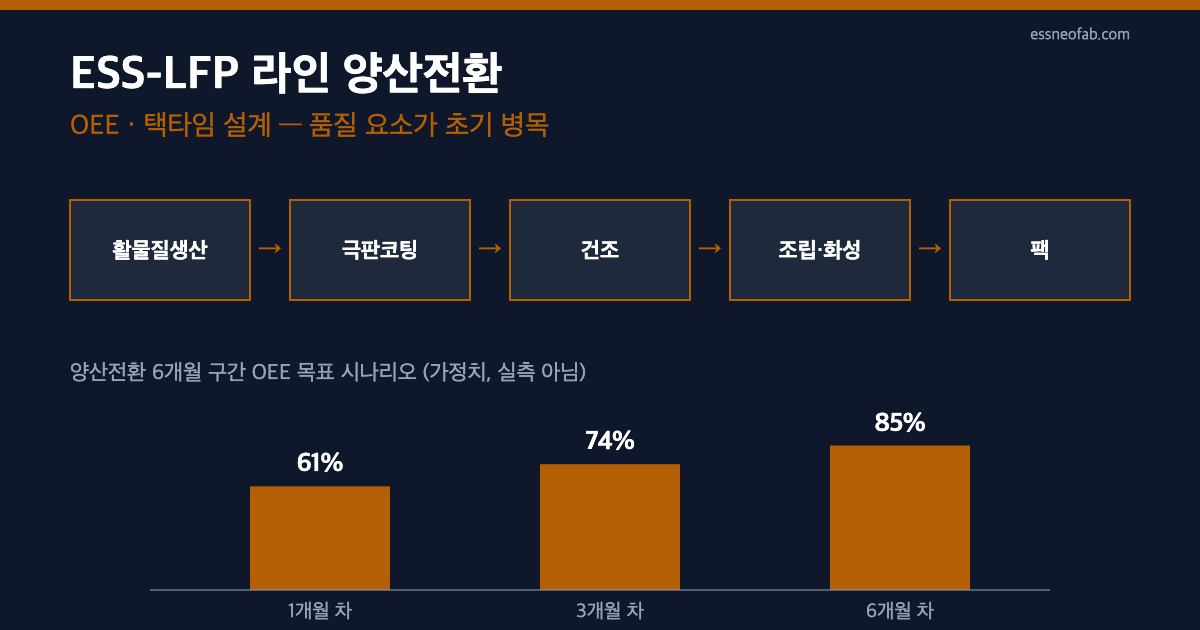
| Month 1 (immediately after commissioning) | 85% | 92% | 78% | approx. 61% | Active-material property variation → formation rejects |
| Month 3 | 90% | 94% | 88% | approx. 74% | Coating-thickness deviation remains, minor equipment losses decrease |
| Month 6 (mass-production target) | 93% | 96% | 95% | approx. 85% | Quality factor stabilizes; performance loss becomes the relatively dominant cause |
The implication of this scenario is that while Availability and Performance converge relatively quickly to around 90% in the initial window, Quality starts at around 78% and takes the longest to improve. In other words, rather than prioritizing resources toward equipment-downtime management (Availability) or speed-loss management (Performance), it is more advantageous for the speed of OEE improvement to first isolate the causal chain of quality loss by cross-verifying formation-process data against active-material lots and coating thickness.
Measurement-condition note: the figures above are a target scenario based on the general improvement pattern of similar cases involving simultaneous new-material and new-line introduction, and are not a 1:1 substitution of lab-scale or pilot results as mass-production performance. They are not PNT’s actual disclosed figures, and require further verification.
4. Trend Snapshot — Standards Changes and System Risk in the Grid Interface
While not directly connected to ESS-LFP line engineering, two trends from the same period carry system-level implications.
4-1. Equipment-Asset Re-Assessment Following Enforcement of the Solid-State National Standard — China’s national standard GB/T 43568-2026 took effect on July 1, 2026, clearly defining the chemical boundaries of solid-state batteries. Reports indicate that, under this standard’s enforcement, CATL’s and BYD’s existing lithium-ion line equipment assets are subject to re-assessment under the new classification criteria. In early August 2026, BYD disclosed six additional patents for a halide-sulfide dual-electrolyte approach, presenting a 2027 target for small-scale trial production, while CATL, around the same time, reaffirmed its own 2027 trial-production plan. From a line-engineering perspective, the implication of this case is not the cell chemistry itself, but that as the revision cycle of the standards defining chemical composition shortens, the depreciation planning and conversion-investment timing for existing line equipment must be separately reviewed.
4-2. Capital-Marketization of ESS Grid-Interconnection Methods — According to reports related to Australia’s market operator, on August 11, 2026, Australian grid-scale battery storage set a record by supplying 14.42% of NEM (National Electricity Market) consumption via a 4,325 MW discharge, and the Q2 2026 battery price spread narrowed 85% year-on-year to an average of AU$51/MWh (approx. US$35/MWh). Around the same period in the US, an analysis found that batteries accounted for 95 of 368 new grid-entry facilities in the first half of 2026, reinforcing the trend of storage being procured as a capacity resource rather than an energy resource. This is cited only as a snapshot suggesting that, within the BMS-PCS-EMS layer, the EMS’s bidding logic needs to expand from simple charge/discharge scheduling to responding to capacity-market bids.
Measurement-condition note: the Australian and US figures are as of each market operator’s/report’s timing (August 2026) and cannot be applied as-is to domestic grid conditions. Separate verification is needed.
5. Summary from a Traceability/ESS-System-Layer Perspective
For an ESS-LFP line to manage quality loss during the ramp-up window, a Traceability system capable of tracing a defective formation lot back to the active-material lot number, coating zone, and drying temperature profile must be in place from the earliest stage of line operation. An equipment maker that directly owns the equipment is well positioned to integrate this data into its own MES, but incorporating the active-material production process into the same lot-tracking system remains a separate system-design challenge. In conclusion, this article’s verification result is that while the equipment maker’s line-ownership shift allows equipment know-how to be leveraged for Availability improvement, early stabilization of the Quality factor depends on the level of Traceability design between active material and process.
FAQ
Q. If the equipment maker directly operates the line, wouldn’t yield stabilize faster thanks to equipment know-how?
A. Equipment know-how clearly benefits the Availability factor (failure prediction, optimized maintenance cycles). However, as in the Section 3 scenario, if the initial bottleneck is the Quality factor — that is, a problem with the combination of new active material and process — equipment operating experience alone does not resolve it. This article’s hypothesis is that without a separate system for cross-verifying active-material property data against formation-reject data, the quality-loss window may take a similar duration even with equipment know-how; this requires separate verification with measured data.
Field Application Notes
A checklist that can be checked immediately during Monday-morning line inspection.
| Check Item | Verification Method | Standard |
|---|---|---|
| Identify the lowest of the three OEE factors | Tally Availability, Performance, and Quality separately from the weekly OEE log | If Quality is lowest, prioritize active-material lot tracing |
| Correlation between active-material lot and formation rejects | Trace defective formation lots back to the incoming active-material lot number | Check whether rejects concentrate within the same lot |
| Coating–drying buffer dwell time | Check the dwell-time log for the buffer section | Investigate the cause if deviation from the target dwell time exceeds 10% |
| Takt-time recalculation cycle | Immediately recalculate takt time whenever customer required quantity changes | Follow the formula Available Operating Time / Customer Required Quantity; do not conflate with cycle time |
Related Reading
- Line Changeover Design in the Era of Low-Price ESS Round-3 Bidding — Flexible Assembly Viewed Through Takt Time and OEE
- StarPlus Energy’s Indiana Plant — The Blended-OEE Illusion Created by Sequential NCA/LFP Commissioning
- Converting EV Lines to ESS: Where Does OEE Break Down?


You May Also Like
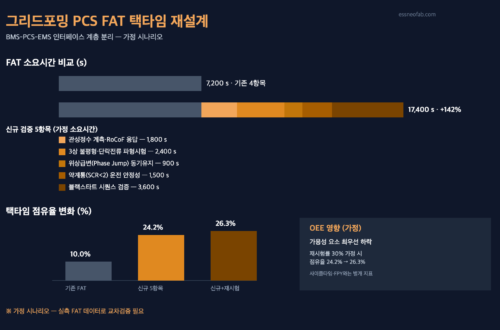
Grid-Forming PCS Mandate Redesigns FAT Takt Time and the BMS-PCS-EMS Interface
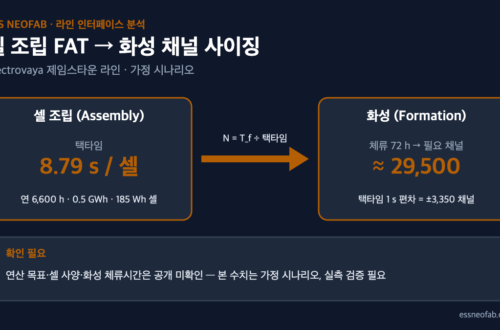
Formation Channel Sizing Read from a Cell Assembly Equipment FAT — How 1 Second of Takt Time Moves 3,350 Channels
One Comment
Pingback: