StarPlus Energy’s Indiana Plant — The Blended-OEE Illusion Created by Sequential NCA/LFP Commissioning
Abstract
The Samsung SDI–Stellantis joint venture StarPlus Energy’s Indiana (Kokomo) plant is bringing four lines online in sequence over 18 months: an NCA line starting October 2025, an LFP line (12 GWh/year) in Q4 2026, and additional NCA and LFP lines in Q1 2027. When lines of different chemistries (NCA, LFP) and end uses (EV, ESS) are commissioned at different times within a single site, a “Blended OEE” that sums the entire site into one number creates an illusion that obscures the actual performance of mature lines.
This article back-calculates Takt Time from the publicly disclosed line-startup schedule and compares site-level blended metrics against line-level OEE under an assumed scenario. The conclusion: during a new line’s commissioning window, OEE should be reported at the line level rather than the site level, and staggering new-line startups so they do not overlap with an existing line’s stable-operation period is valid from a Line Balancing standpoint.
1. Why Site-Level Blended OEE Creates an Illusion
When battery lines of different chemistries are added sequentially within a single site, the metric management typically references is a blended OEE for the entire site. However, while a new line is in its commissioning phase, this blended figure makes the actual operating performance of mature lines look worse than it is. (S) The Samsung SDI–Stellantis joint venture StarPlus Energy disclosed a sequential schedule in which, after starting an NCA line for ESS use in October 2025, it will add an LFP line (12 GWh/year) in Q4 2026 and one NCA line and one LFP line each in Q1 2027.
(C) The issue is that these four lines trace stabilization curves at different points in time — the NCA line, started earlier, has likely already entered its mature phase, while the LFP line, set to start in Q4 2026, has yet to pass through its typical early low-yield phase. (Q) When the results of these two lines are summed and reported as a single site-level OEE, what exactly is being observed?
(A) As the assumed-scenario calculation in Section 3 below shows, the blended OEE can diverge from the mature line’s actual operating performance by more than 20 percentage points. This is not an error in the KPI itself, but a limitation of an aggregation method that lumps together lines at different points in their life cycle into a single number.
2. StarPlus Energy’s Indiana Plant: Current Status and Line Schedule
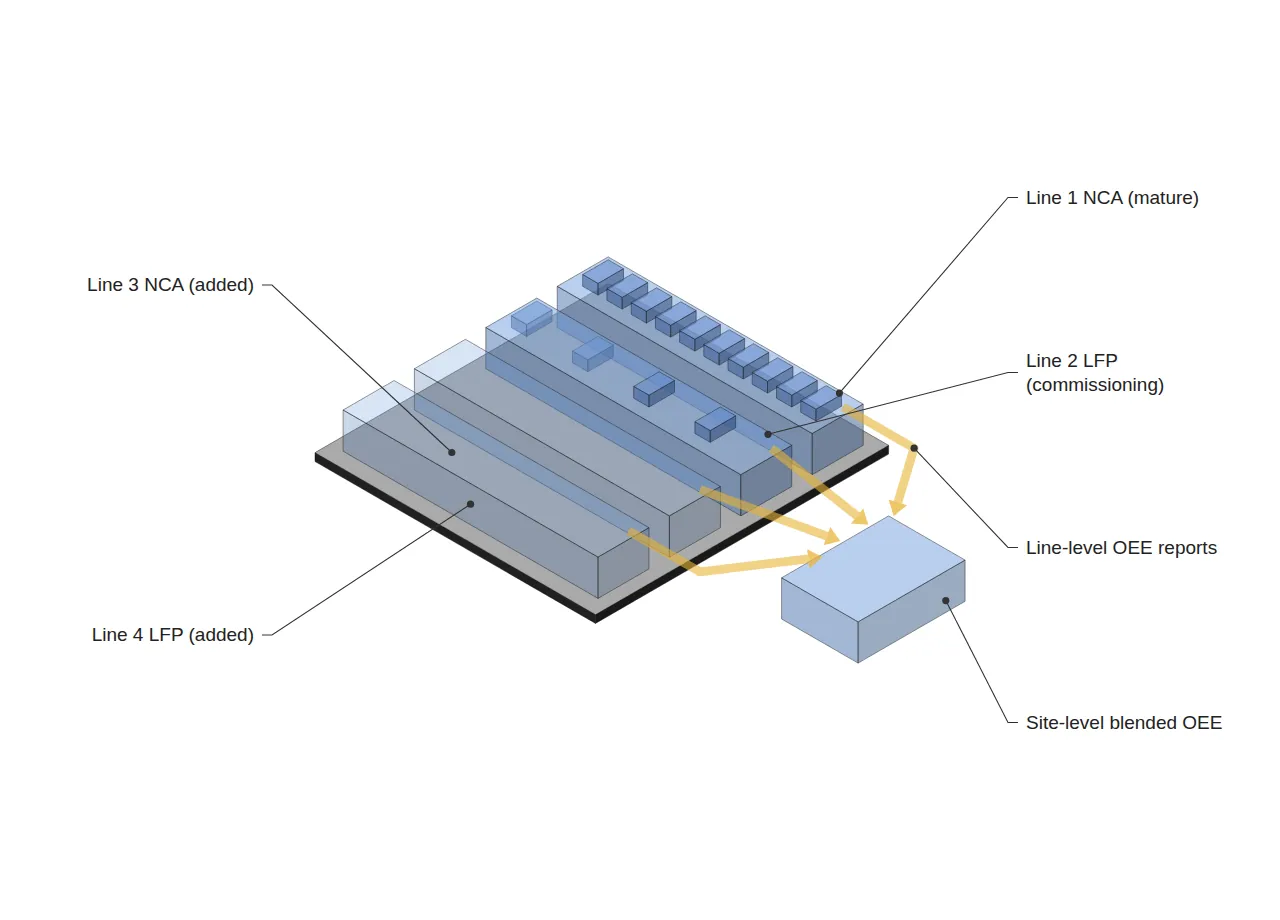
Based on publicly reported coverage, the line-startup schedule for StarPlus Energy (Kokomo, Indiana) is as follows.
| Timing | Line | Chemistry | Use | Notes |
|---|---|---|---|---|
| Oct 2025 | Line 1 | NCA | ESS | Already operating — presumed to have entered its mature phase |
| Q4 2026 | Line 2 | LFP | ESS | 12 GWh/year scale; the main subject of this article’s calculations |
| Q1 2027 | Line 3 | NCA | Stellantis EV | Additional line scheduled to start |
| Q1 2027 | Line 4 | LFP | ESS (assumed) | Additional 12 GWh/year scale — end use requires verification |
Samsung SDI has stated that it will “expand its U.S. ESS production capacity to approximately 30 GWh/year by the end of 2026,” but public materials do not confirm whether this figure refers to the StarPlus Energy site alone or to Samsung SDI’s entire U.S. footprint (including other sites) — requires verification. The rated production capacity (GWh) of the NCA ESS line is also undisclosed, and whether the NCA and LFP lines share upstream equipment such as electrode processes or are fully separate lines is likewise left as an item requiring verification.
3. Back-Calculating Takt Time and Blended OEE (Assumed Scenario)
The calculations below are based solely on the officially announced LFP line capacity (12 GWh/year); all other variables (cell specifications, operating conditions, NCA line capacity and OEE performance) are assumptions. They are presented strictly as a scenario, on the premise that empirical verification is required.
3-1. Back-Calculating the LFP Line’s Takt Time
Assumptions: cell spec 100 Ah × 3.2 V = 320 Wh/cell; operating condition of 300 days/year × 2 shifts × 22 h.
| Item | Value | Formula |
|---|---|---|
| Annual target output | 12,000,000,000 Wh | Officially announced figure |
| Energy per cell (assumed) | 320 Wh/cell | 100 Ah × 3.2 V |
| Annual cell count | 37,500,000 cells | 12,000,000,000 ÷ 320 |
| Annual operating time | 23,760,000 s | 300 days × 22 h × 3,600 s |
| Takt Time | approx. 0.63 s/cell | 23,760,000 ÷ 37,500,000 |
3-2. Assumed Line-Level OEE and Blended OEE
OEE = Availability × Performance × Quality (fixed definition). It is not used interchangeably with Cycle Time or FPY.
| Line | Availability | Performance | Quality | OEE |
|---|---|---|---|---|
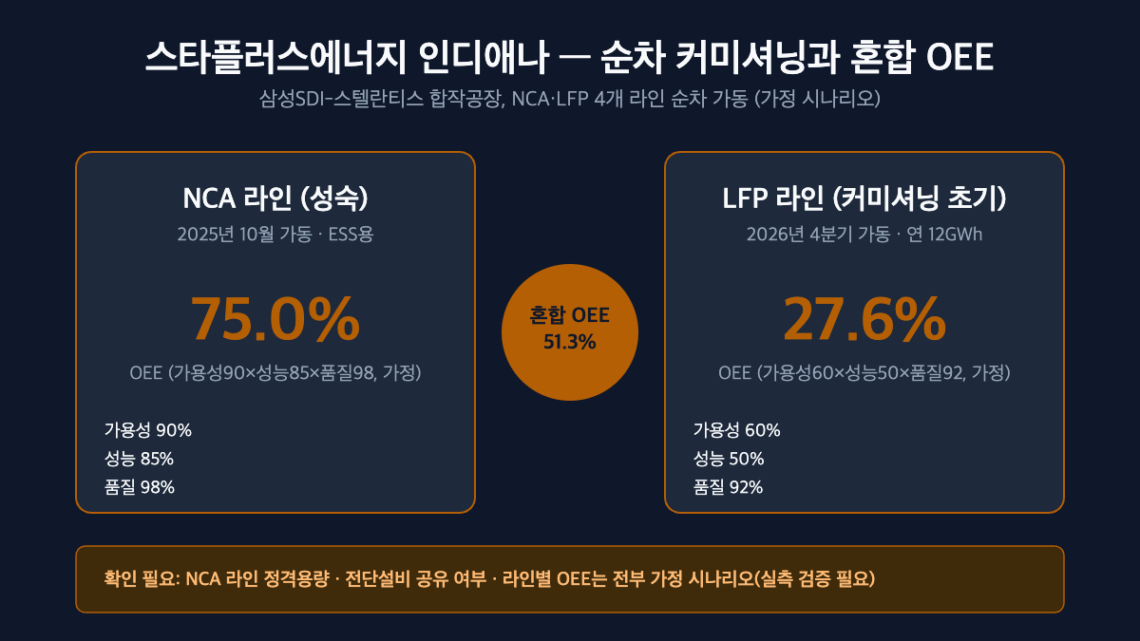
| NCA Line 1 (mature, assumed) | 90% | 85% | 98% | approx. 75.0% |
| LFP Line 2 (early commissioning, assumed) | 60% | 50% | 92% | approx. 27.6% |
Assuming the two lines have equal capacity (12 GWh each, assumed) and calculating a capacity-weighted blended OEE gives (12×75.0%+12×27.6%)/24 ≈ 51.3%. In other words, a gap of about 23.7 percentage points arises between the NCA line’s standalone performance (75.0%) and the site-blended metric (51.3%) — this gap is not an equipment or workforce problem, but an illusion created by an aggregation method that sums lines at different life-cycle stages into one. This reaffirms the need for the “measurement-condition annotation” that essneofab has repeatedly emphasized: when citing OEE, one must always specify which line and which period (mature phase or commissioning phase) the figure refers to.
4. Trend Snapshot
Two items reviewed during this week’s material selection but not promoted to the main topic are briefly noted here.
- The 3rd ESS central contract market bid announcement is imminent in September (approximately KRW 1 trillion, for 2028 delivery volume) — essneofab has already covered the mixed-model/changeover issue of the 3rd bid as a main topic in an earlier article, so it is mentioned here only as a snapshot.
- Ecopro has formalized its entry into the battery market for humanoid robots based on high-nickel/solid-state materials (2026-09-07) — since cell-level chemistry and material R&D fall outside this site’s scope, only the system-layer fact of “battery components entering the supply chain for robotic systems” is recorded here. No assessment is made of the material’s own performance or stability.
5. Conclusion and Implications
When lines of different chemistries and end uses are commissioned in four sequential stages over 18 months at a single site, as with StarPlus Energy, a site-blended OEE during periods of overlapping commissioning windows is an inappropriate basis for judging actual equipment performance. Where a single line’s EV-to-ESS conversion addressed “what changes within one line,” and capacity allocation between two production sites addressed “how volume is divided between multiple sites,” this case addresses a different layer of the problem — “how KPIs should be separated when lines are added sequentially within the same site.” In practice, a sequencing strategy of reporting line-level and site-blended OEE side by side, and staggering new-line startups so they do not overlap with an existing line’s stable-operation period, is valid. However, all quantitative figures in this article are assumed-scenario values, and further verification against actual line-level performance data is required.
Metric definitions: Takt Time = available operating time ÷ customer-required quantity. In this article these metrics are not used interchangeably with Cycle Time or FPY.
FAQ
Q. Isn’t low OEE during a new line’s early commissioning normal? Why does it need to be separated from the site-blended metric?
A. Low OEE during early commissioning is indeed a normal phenomenon. The problem is that when it is summed with the entire site’s performance and reported as a single number, it makes the actual operating capability of an already-stabilized line appear underrated. To use this as a basis for decisions such as equipment investment or workforce allocation, line-level figures must be separated so the cause (new-line ramp-up vs. existing-line degradation) can be accurately distinguished.
Field Application Notes
| Item | Monday-Morning Action |
|---|---|
| KPI separation | From the moment a new line starts operating, report line-level OEE weekly alongside — separately from — the site-blended OEE. |
| Defining the commissioning period | Predefine the “commissioning-completion criterion” for a new line (e.g., achieving a target OEE of 70% for 3 consecutive weeks) to clearly mark the point of entry into the mature phase (finalize the figure based on actual on-site measurement). |
| Sequencing review | When scheduling the next line’s startup, check in advance whether it overlaps with an existing line’s stable-operation period. |
| Items requiring verification | NCA line’s rated capacity, whether lines share upstream equipment, the aggregation scope of the “U.S. ESS 30 GWh” figure — cross-verify against official IR materials before incorporating into this calculation. |
Related Reading
- Converting EV Lines to ESS: Where Does OEE Break Down?
- SK On’s Dual-Site ESS Production Bases — Where Fixed Contracts and Variable Bidding Split Takt Time Design
- The Equipment Maker’s Line-Ownership Shift — OEE and Takt-Time Design During the ESS-LFP New-Line Mass-Production Ramp-Up


One Comment
Pingback: