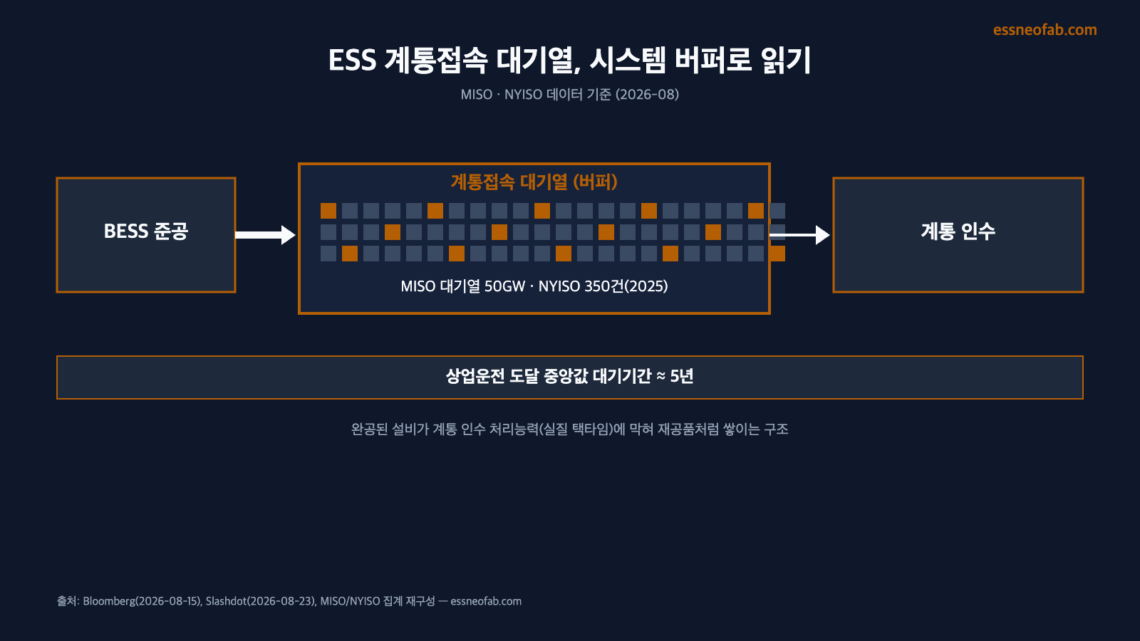
Re-Reading the ESS Grid-Interconnection Queue in the Language of Line Balancing
Abstract
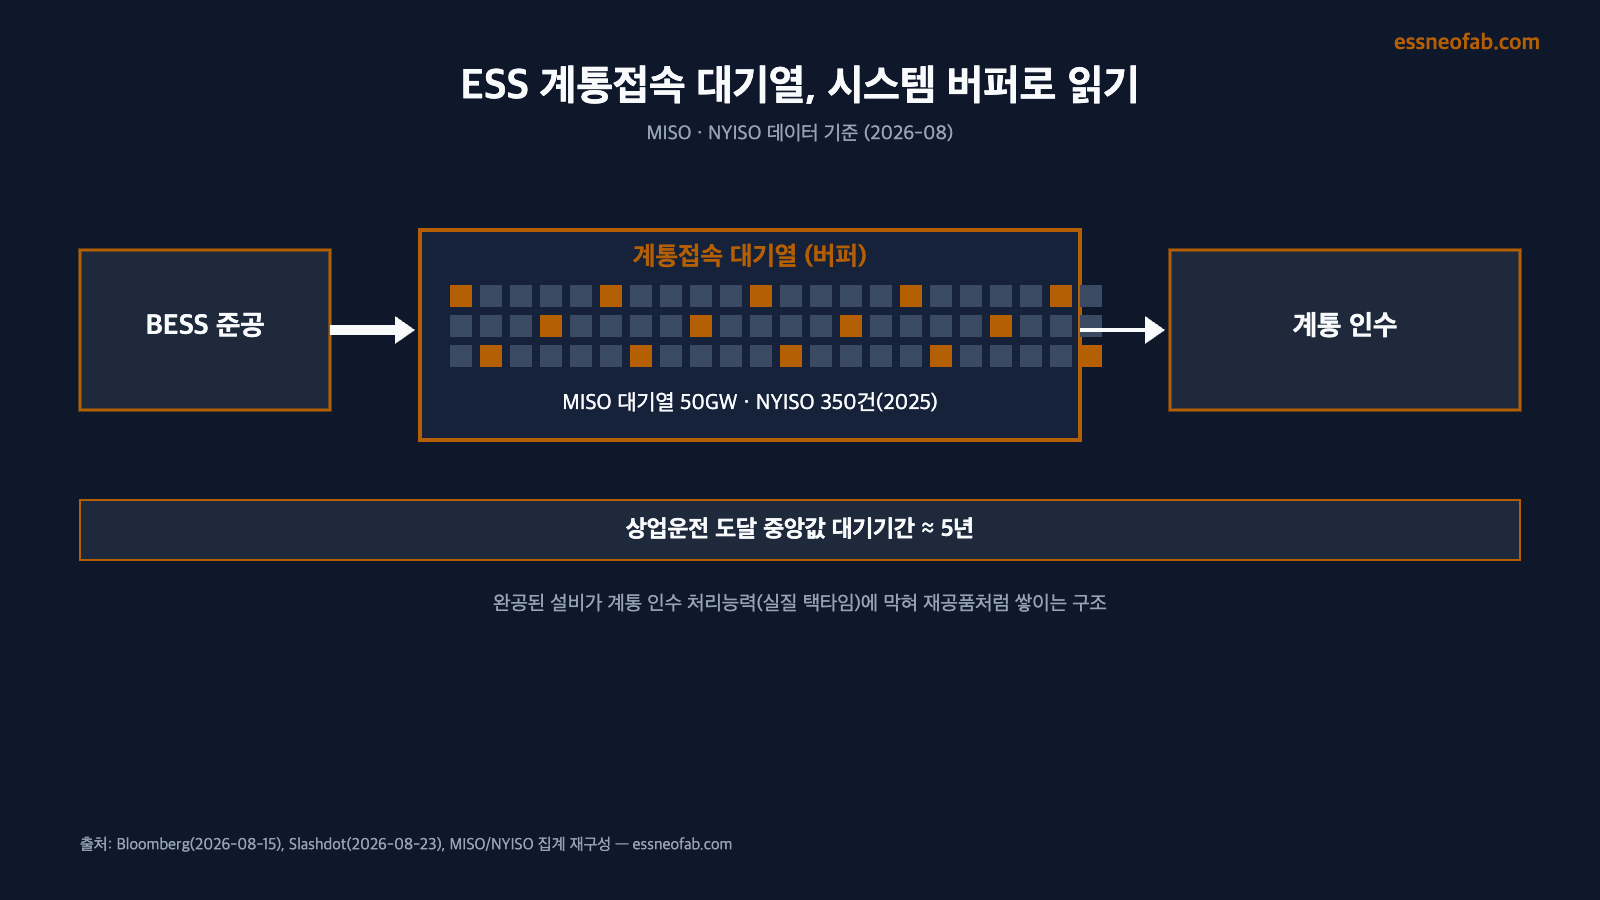
The stalled BESS (Battery Energy Storage System) commissioning cases in the US, reported successively by Bloomberg and Slashdot in August 2026, show that even after equipment is completed, delays recur at a separate bottleneck section called the grid-interconnection queue. BESS accounts for about 50 GW of MISO’s total 650 GW queue, the number of NYISO’s queued projects grew from 176 in 2018 to 350 in 2025, and the median wait time to reach commercial operation approaches 5 years. This article redefines this phenomenon using the line-engineering concepts of buffer, interface, and takt time, analyzing it as a work-in-process inventory structure in which completed equipment piles up without being able to move on to the next process (grid acceptance). However, because the cited figures are compiled under differing country- and agency-specific criteria, separate verification is needed before applying them 1:1 to domestic cases.
1. Why Completed ESS Remains in the Queue
To state the conclusion first, a significant portion of US BESS projects are stalled not at equipment completion but at the interface stage of grid-interconnection approval. This is not a problem with the line itself, but a system-level matching failure between the line’s output rate and the next process’s (the grid’s) acceptance rate.
[Situation] New storage additions to the US grid in the first half of 2026 are shifting toward procurement as “capacity” rather than “energy,” meaning underlying demand for storage equipment itself remains solid. [Complication] However, Bloomberg reported on August 15, 2026 that numerous BESS projects are stalled in commissioning due to utility grid-upgrade delays, and a report re-cited by Slashdot on August 23 pointed out that supply-chain issues are further compounding installation delays. [Question] Is this delay, then, a problem of the line’s production capacity, or of the processing capacity of the interface behind it? [Answer] The data suggests the latter — the fact that the cumulative capacity of the US interconnection queue reaches 2,600 GW, and the median wait time to reach commercial operation approaches 5 years, suggests that the bottleneck lies in the interface throughput of review and approval, rather than in the equipment itself.
This structure differs mechanistically from the domestic substation connection-restriction case essneofab covered previously (as of 2026-08-22). Whereas the domestic case restricted the connection capacity itself at the pre-bid stage, this US case is a downstream bottleneck in which already-completed equipment sits idle awaiting approval — a distinct mechanism worth addressing separately.
2. The Grid-Interconnection Queue in Data
The quantitative data is summarized below. Because the figures below were compiled by different organizations (MISO, NYISO, FERC-related reporting) at different times and with different methodologies, it is recommended to reference each independently rather than simply summing or directly comparing them.
| Indicator | Value | Measurement-Condition Note |
|---|---|---|
| Cumulative capacity of the total US interconnection queue | approx. 2,600 GW | 2026-basis tally; solar, storage, and wind account for 95% of the queue (composition ratio from a 2024 prior survey; update margin needs separate confirmation) |
| Median wait time to reach commercial operation | approx. nearing 5 years | Combined median across all power-source types; some sectors, such as data centers, reportedly reach up to 12 years |
| BESS share within the MISO queue | approx. 50 GW / 650 GW total | MISO single-region-grid basis, 2026 snapshot |
| Change in NYISO queued-project count | 176 (2018) → 350 (2025) | approx. 2x increase over 7 years; project scale (MW) not reflected — count-based statistic |
| New-project withdrawal rate | approx. 80% | Multi-year delay and high grid-upgrade cost reported as the primary withdrawal reasons |
Against this comparison baseline, the implication is clear. The fact that NYISO’s queued projects doubled in 7 years means that approval-processing speed is not keeping pace with the inflow rate of applications — a classic sign of queue divergence. The figure that roughly 80% of new projects are withdrawn can also be interpreted as a quality indicator, in the sense that a substantial share of the volume entering the queue actually fails to pass through the system and exits as a “defect.”
3. Reinterpretation from a Line/System Engineering Perspective — Buffer, Interface, Takt Time
In line engineering, a buffer refers to the work-in-process (WIP) inventory that accumulates when the output of an upstream process cannot be immediately absorbed by the downstream process. Applying this frame directly, the entire set of BESS equipment that is completed but not yet connected to the grid constitutes one massive buffer inventory. However, unlike a typical line buffer, which is constrained by physical space on a conveyor (spacing in mm), this buffer differs in that it is constrained by a regulatory and technical ceiling called grid-acceptance capacity.
The concept of interface also needs redefinition. An interface normally refers to the physical or data boundary between two processes (e.g., a conveyor handoff point), but in this case the interface is the entire administrative and technical review process between “equipment-completion time” and “grid-approval time.” The processing capacity of this interface is what determines the effective throughput of the entire system.
Let us now extend the concept of takt time (= Available Operating Time / Customer Required Quantity) to the system level. If “customer” here is substituted with the grid operator, and “customer required quantity” with the actual number of grid-interconnection approvals processed annually, the effective takt time of the next process — the grid — can be estimated. The following is strictly an illustrative model, and it is made explicit here that it does not replace each grid operator’s official throughput statistics.
| Variable | Example Target Value | Note |
|---|---|---|
| Available operating time (annual, review-agency basis) | 31,536,000 s (assuming continuous 365-day operation) | Actual review agencies operate on a business-day basis, so this is an upper-bound estimate |
| Customer required quantity (target, annual approvals processed) | 200 cases (hypothetical target) | Not an official statistic — a target scenario set higher than NYISO’s net annual increase (approx. 25 cases) |
| Resulting takt time (target) | approx. 157,680 s/case (≈ equivalent to 43.8 hours/case) | A target processing interval — a throughput indicator distinct from the actual approval duration (years) |
The point of this table is not the absolute value but the structure. The gap between the target takt time (equivalent to approx. 43.8 hours/case) and the actually observed approval duration (on the order of years) is itself the root of the buffer backlog. In line engineering, a takt-time shortfall of this magnitude would immediately be flagged as a bottleneck process and become a candidate for capacity expansion or parallelization, but the grid interface has the limitation that, given its nature as a regulatory and safety review, it cannot be resolved through simple parallelization — this falls outside the process-engineering scope of this article and requires separate institutional review.
4. Recent Trend Snapshot
On the cell/materials axis during the same period, a race to begin pilot production stands out. On August 7, 2026, BYD disclosed six new solid-state battery-related patents, including a halide-sulfide dual electrolyte, and announced plans for small-scale trial production and camouflaged test-vehicle road evaluation in 2027; CATL responded on August 11 by reaffirming its own 2027 pilot-production target. Both cases are noteworthy less for cell-internal chemistry than as a production-management event — “the simultaneous start of pilot lines” — and linking pilot results directly to mass-production performance would be premature, requiring further verification.
In the cylindrical cell format, Envision AESC has begun mass production of the 46120 (φ46mm×120mm) cell, first applied to the BMW iX5. The approximately 30% increase in available energy per cell compared to the existing 4695 cell is a signal that 46-series standardization is moving into the actual mass-production stage, a matter that could have cascading effects on future assembly-line cell-handling and welding process specifications.
5. Conclusion and Implications
The ESS grid-interconnection queue problem should accurately be read not as a problem of the equipment manufacturing line, but as a throughput problem of the interface that follows it (grid approval). From a line engineer’s perspective, the implication of this case is that when diagnosing a bottleneck, one must measure not only within the line itself but also the takt time of the next system that receives the line’s output. Since similar structures (substation connection restrictions, annual caps in the long-duration ESS bid market) have already been observed domestically, the processing capacity of the grid interface needs to be modeled as a separate variable in equipment-investment decisions.
FAQ
Q1. Can the US grid-interconnection delay case be applied directly to domestic ESS line design?
No. Review procedures and bottleneck structures differ by US state and grid operator (RTO/ISO), and the takt-time figures presented in this article are an illustrative model, not actual agency statistics. For domestic application, official throughput statistics from KEPCO and the Korea Power Exchange must be separately confirmed.
Q2. Isn’t applying the line-engineering concept of takt time to a national grid-review procedure an overreaching analogy?
This methodological limitation is acknowledged. Takt time is a metric originally defined on the premise of a repeatable production process, and applying it directly to a procedure like regulatory review, which has large case-by-case variance, can reduce statistical significance. This article limits its use to an analogical frame for explaining the bottleneck structure, not a rigorous quantitative model.
Field Application Notes
Items that an ESS equipment-investment reviewer can check immediately on Monday morning are as follows.
| Check Item | Verification Method | Follow-up Action |
|---|---|---|
| Net queue growth trend at the target grid operator | Check the rate of change in the number of queued projects over the past 5 years | If the net growth rate exceeds the approval-processing rate, conservatively re-estimate the pre-construction wait time |
| Review of project-withdrawal history | Classify the reasons (cost, delay) for recent withdrawal cases within the same grid | Specify the party responsible for grid-upgrade cost burden at the contract stage |
| Buffer-cost calculation between completion and approval | Itemize the capital cost (interest, depreciation) of the idle period after completion separately | Establish a new “grid-wait buffer” cost line item in the financial model |
| Parallel-application strategy review | Confirm whether simultaneous applications to multiple grid-connection points are possible | Diversify the risk of dependence on a single connection point |
※ The figures cited in this article are based on data published by each source organization/outlet as of August 2026, and because the estimation basis (sample scope, tally timing) may differ by organization, caution is needed in direct comparison. A separate verification procedure is recommended for domestic-application decisions.
Related Reading
- Long-Duration ESS Interface Design in the Era of Power-Grid Saturation
- 128 MW of Distribution-Grid ESS Volume Allocated — Can the Battery Pack Assembly Line Absorb the Takt Time?
- Grid-Forming PCS Mandate Redesigns FAT Takt Time and the BMS-PCS-EMS Interface


You May Also Like
Embedding an AI Vision Inspection Gate in the Line: Redefining OEE and Takt-Time Design Variables
Pylontech’s 588 Ah and 601 Ah LFP Cells Enter Mass Production — Why Energy-Weighted Availability Stays the Same When the Cell Count Halves
One Comment
Pingback: