128 MW of Distribution-Grid ESS Volume Allocated — Can the Battery Pack Assembly Line Absorb the Takt Time?
Abstract
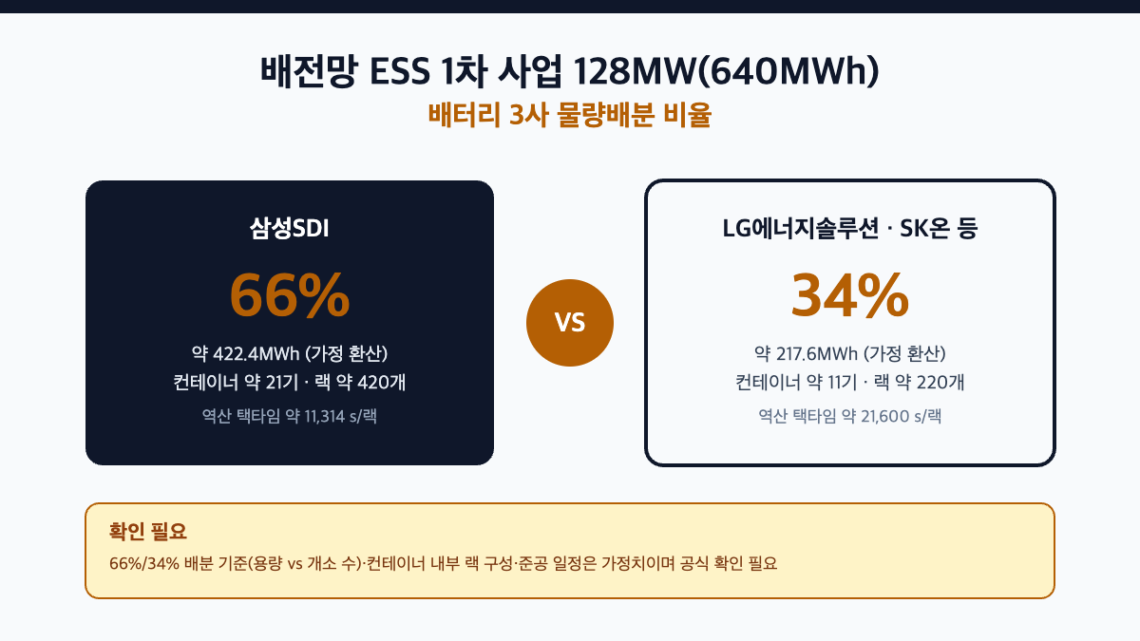
The Ministry of Climate, Energy and Environment’s Phase 1 distribution-grid ESS project — linked to additional renewable-energy interconnection — confirmed 9 operators and allocated a combined 128 MW (640 MWh) across 32 distribution feeders. Samsung SDI recorded the largest award at 66%, with LG Energy Solution and SK On splitting the remainder. This article converts that volume-allocation ratio into a load distribution across battery-pack assembly lines, and back-calculates, under an assumed scenario, how far the takt time diverges between operators. The conclusion is that a difference in procurement-volume ratio is carried straight through into a load imbalance at the production-line design stage, so Line Balancing review must be conducted together, starting from the moment the volume allocation is announced.
1. Distribution-Grid ESS Volume Allocation Is Not a Procurement Issue — It Is a Line-Design Input
To state the conclusion first: the per-operator volume-allocation ratio in the distribution-grid ESS project (Samsung SDI 66% vs. the remaining 34%) already determines, at the moment of announcement, the load distribution of each operator’s battery-pack assembly line. The moment the volume is confirmed, takt-time and line-balancing design must follow.
Situation — In renewable-energy-dense regions such as Honam and Jeju, substation and distribution-feeder capacity is saturated, delaying grid interconnection for new solar. The government has responded by investing KRW 558.6 billion in national funds from 2026 to 2030 to install ESS at the distribution-feeder level.
Complication — In the first-half 2026 Phase 1 solicitation, 9 operators were allocated a combined 128 MW (640 MWh) across 32 distribution feeders, with batteries supplied by three domestic companies and Samsung SDI taking 66%. The problem is that the moment this ratio is disclosed, each operator’s battery-pack assembly line takes on a production load of a different magnitude.
Question — Within a fixed completion schedule, what concrete gap does the volume-allocation ratio difference create in assembly-line takt time?
Answer — Back-calculated under an assumed scenario, the gap widens to roughly a factor of 2 (see Section 3). This means the volume-allocation table itself must become an input to the line-design document.
2. Project Structure and Interface Hierarchy
This Phase 1 project installs ESS units of 4 MW / 20 MWh at each distribution feeder to bring solar-interconnection-queue volume onto the grid. Nine operators (VPP Lab, LG Energy Solution, KEPCO KDN, SK Eternix, HD Hyundai Electric, Gridwiz, Korea East-West Power, Korea Midland Power, and Hyundai E&C) split the 32 distribution feeders among themselves, with three battery companies supplying cells and packs on top of that — a two-tier structure.
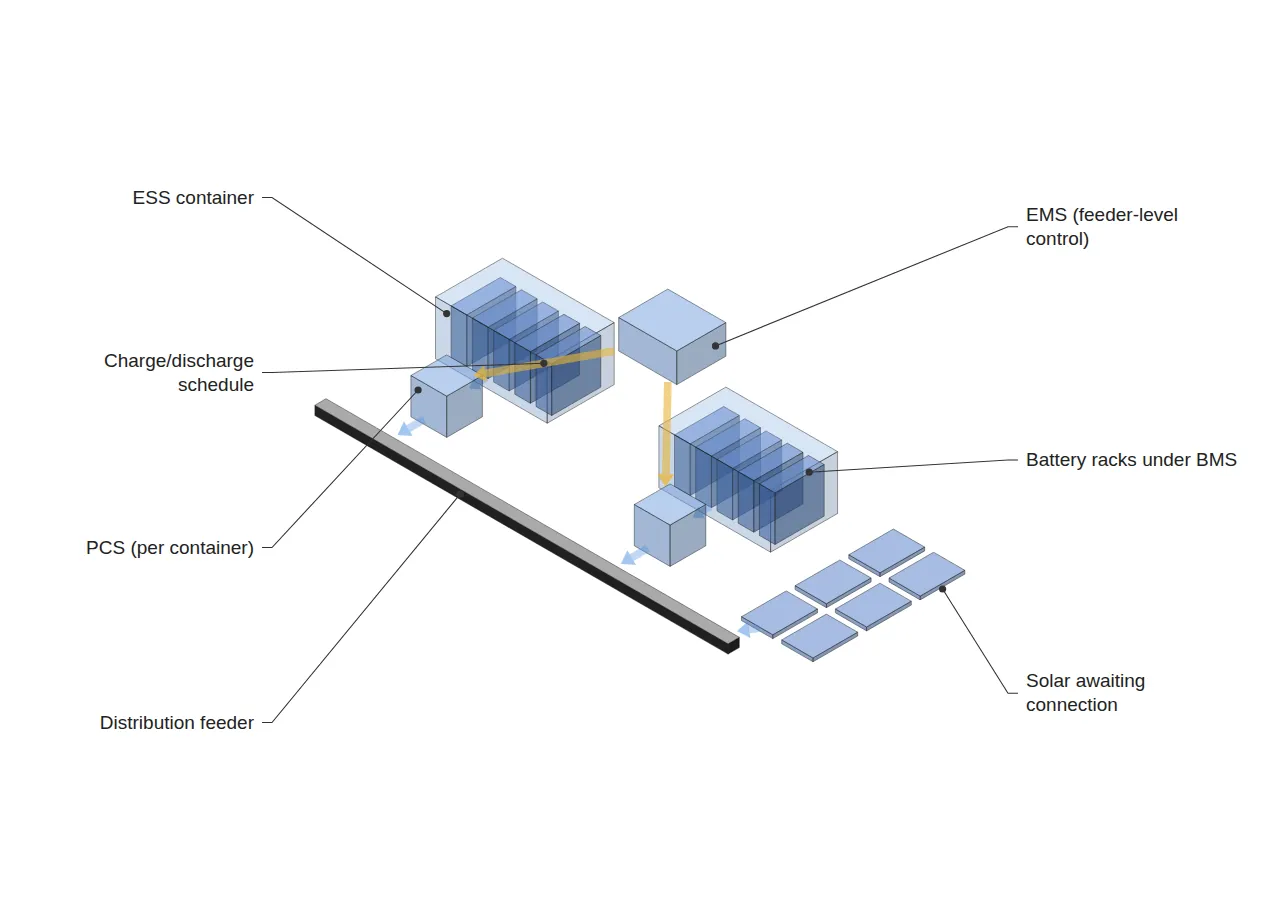
In terms of system hierarchy, the EMS (Energy Management System, distribution-grid-level integrated control) sits at the top and directs the charge/discharge schedule of each container; below it, per-container PCS (Power Conversion System) units convert between AC and DC in line with the distribution feeder’s protection-coordination conditions; and at the bottom, BMS (Battery Management System) handles rack/module-level cell balancing and safety cutoff. Given that this is a public infrastructure project, battery-pack-level Traceability — cell lot numbers, assembly history, pre-shipment test certificates — is likely to be included in the procurement contract conditions, but the official procurement specification has not been confirmed, so this is left as an item requiring confirmation.
3. Assumed Scenario: Converting the Volume-Allocation Ratio into Takt Time
The figures below use only the reported ratios (66%/34%, 128 MW · 640 MWh, 4 MW · 20 MWh units) as actual values; all remaining assembly-process conditions are assumed. Until empirically verified, use these only to confirm the direction in which the allocation ratio is carried through into line load, not as absolute values.
- Assumed container internal configuration: 20 MWh/container = 20 racks × 1 MWh/rack (no public data available; assumed value)
- Assumed completion target: assuming assembly completion by end of November 2026 following operator selection (2026-07-10) → available period of approx. 12 weeks
- Assumed operating conditions: 5 days/week, 2 shifts × 22 hours/day (applying the same convention as in prior cases)
| Category | Volume Share | Converted Capacity | Container Count (assumed) | Rack Count (assumed) | Available Operating Time (assumed) | Back-Calculated Takt Time |
|---|---|---|---|---|---|---|
| Samsung SDI | 66% | approx. 422.4 MWh | approx. 21 units | approx. 420 racks | 4,752,000 s | approx. 11,314 s/rack (approx. 3.14 h/rack) |
| LG Energy Solution, SK On, etc. | 34% | approx. 217.6 MWh | approx. 11 units | approx. 220 racks | 4,752,000 s | approx. 21,600 s/rack (approx. 6.00 h/rack) |
Applying the definitional formula Takt Time = Available Operating Time ÷ Customer Required Quantity as-is, because the volume differs by nearly a factor of 2 within the same available time, the back-calculated takt time also diverges by roughly a factor of 1.9. However, this value assumes the entire volume is produced sequentially on a single line; in practice, production is distributed across the multiple lines each operator holds, so the significance lies not in the absolute figures but in confirming the design principle that “the allocation ratio carries straight through into the load-distribution ratio.” The exact number of lines, parallel configuration, and completion schedule are items requiring confirmation.
4. Trend Snapshot
CIS is operating a continuous sulfide-based solid-state-electrolyte pilot line, and it is reported that a mass-production order for its hybrid coater is imminent. As this represents a transition point where R2R coater equipment moves from pilot to mass-production stage, follow-up verification of the future interface design (coating thickness/line-speed coordination) will be needed.
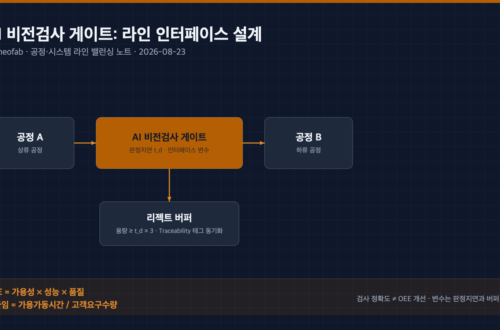
Meanwhile, at AW Vietnam 2026, to be held September 9–11 in Hanoi, Machine & Vision’s standard AI vision-inspection system “VisionMate,” Bison’s edge-AI vision-inspection platform, and Zex Company’s industrial PC for edge-AI computation are scheduled to be introduced. As with the gateway-aggregation structure of battery lines (see #208, #213), the trend continues toward edge devices processing inspection decisions locally.
5. Conclusion and Implications
Distribution-grid ESS volume allocation is easily consumed as ordinary order-win news, but from a systems-engineering perspective, it is the moment the input values for assembly-line takt-time and line-balancing design are fixed. The longer the gap between when the volume ratio is disclosed and when the line load is recalculated, the greater the completion-schedule risk becomes.
This article addresses a different layer from an earlier one that examined the OEE loss point of an individual production site (EV 라인의 ESS 전환, OEE는 어디서 깨지는가). If #184 analyzed conversion loss inside a single plant, this article addresses the structure in which a national infrastructure project’s volume-allocation table is carried, simultaneously, as a load into several operators’ lines. It is also distinct from the article on the U.S. BESS grid-interconnection queue bottleneck (ESS 계통접속 대기열, 라인 밸런싱 언어로 다시 읽기): if that article explained the demand-side bottleneck itself, this article addresses how the supply volume invested to resolve that bottleneck is actually absorbed at the production site.
FAQ
Q. Isn’t the volume-allocation ratio a matter for the construction/procurement department, unrelated to production-line engineering?
A. Procurement volume is an input variable to the production plan (MPS), and takt time and line balancing are outputs derived from that input variable. If the line side does not recalculate load at the moment the allocation ratio is disclosed, the structure becomes one where the bottleneck surfaces only when the completion schedule is imminent. The volume-allocation announcement should therefore be treated as both a procurement event and a line-design trigger.
Field Application Notes
| Check Item | Verification Method | Note |
|---|---|---|
| Official confirmed figure for our (or partner’s) allocated volume (MW/MWh) | Cross-check against the project announcement/contract original text | The reported ratio (66%/34%) may be an approximation |
| Actual container/rack configuration specification | Confirm against the design spec sheet | This article’s 20 racks/container is an assumed value |
| Completion target date and back-calculated available operating time | Confirm against the project schedule | Compare the 2-shift × 22h/day assumption against the actual operating plan |
| Required Traceability level (cell lot/test-certificate scope) | Confirm against procurement contract conditions | May be stricter given this is a public project — confirmation needed |


You May Also Like
Designing the Merge Point in a 10 GWh Pack-Container Integration Line: Synchronizing Two Upstream Lines and Sizing AGV Fleet from the Powertrac × Sunka Lead Order
Between the Continuous Solid-Electrolyte Process and the Assembly Line: How Should the Buffer Interface Be Designed?
One Comment
Pingback: