When the Station Block Grows to 62 MWh, What Actually Shrinks Is Commissioning Labor, Not Cell Count
Abstract
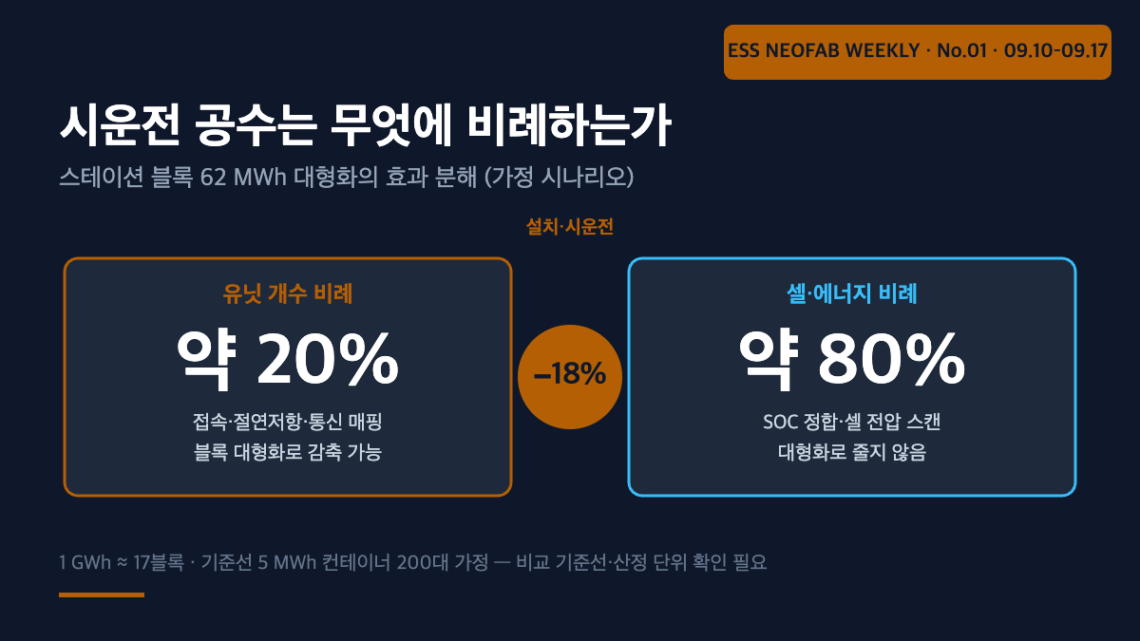
On September 16, 2026, BYD unveiled its second-generation grid-forming station block, the “GC Block,” in a maximum 10 MW/62 MWh single configuration, stating that a 1 GWh project would require approximately 17 blocks. The same announcement claimed a 69.4% reduction in BMS management complexity, a maintenance workload reduction of over 60%, and an installation/commissioning workload reduction of over 18%. Working backward from these three figures using the same assumed unit-count reduction rate (91.5% under a baseline assumption), the unit-count-proportional share of on-site commissioning labor turns out to be only about 20%, with the remaining roughly 80% proportional to cell/energy count. In other words, block enlargement is a lever that attacks only about one-fifth of total commissioning labor — doubling block capacity again yields only about a 10% additional reduction in commissioning labor.
1. Conclusion first — what a larger block reduces is not cells, but interface[1] contact points
The real effect of station block enlargement is not a reduction in cells per unit of energy, but a reduction in the number of repeated interface contact points on site. And this effect varies sharply by category: it acts strongly on BMS complexity, but weakly on commissioning labor.
Situation (S): As gigawatt-scale BESS[2] projects increase, securing on-site construction and commissioning labor has become a real constraint on project schedules. Complication (C): Manufacturers are attempting to relieve this constraint by enlarging the unit itself. On September 16, 2026, at the “2026 Energy and Green Development Conference & International Digital Energy Expo” in Shenzhen, BYD unveiled three standard GC Block configurations — 7.5 MW/15.5 MWh (2-hour), 7.5 MW/31 MWh (4-hour), and 10 MW/62 MWh (6-hour) — and stated that a 1 GWh project would consist of roughly 17 blocks. Question (Q): How much does enlarging the unit actually reduce on-site labor? Answer (A): Only the work proportional to unit count decreases — and that share is only about 20% of commissioning labor.
The assumption this article sets out to challenge is the common belief that “larger units mean proportionally less on-site work.” Placed on a common basis, the three published figures do not support that belief.
2. Mechanism — splitting commissioning labor into two terms makes it visible
On-site commissioning labor can be expressed as the sum of a unit-count-proportional term and a cell/energy-count-proportional term:
Ctotal = A · Nunit + B · Ncell
Here A is the per-unit labor for work that must be repeated for every single unit (electrical/communication/cooling connections, insulation resistance measurement, communication address mapping, grid-forming[3] parameter setup, unit-level functional testing), and B is the per-cell/module labor for work proportional to cell/module count (SOC alignment, cell voltage scanning, individual sensing wiring verification). At a fixed energy scale, Ncell barely changes, so block enlargement affects only the A · Nunit term.
Assuming a baseline of a 5 MWh, 20 ft container, a 1 GWh project would require 200 units, whereas the 62 MWh block requires approximately 17 units, giving a unit-count reduction rate of (200 − 17)/200 = 91.5%. Dividing each published reduction rate by this unit-count reduction rate backs out the unit-count-proportional share embedded in each figure.
| Announced item | Announced reduction | Assumed unit-count reduction | Back-calculated unit-count-proportional share | Interpretation |
|---|---|---|---|---|
| BMS management complexity | 69.4% | 91.5% | ≈75.8% | Dominated by number of management nodes — directly reflects hierarchy consolidation |
| Maintenance workload | 60%+ | 91.5% | ≈65.6% | Dominated by number of units to inspect |
| Installation/commissioning work | 18%+ | 91.5% | ≈19.7% | About 80% is cell/energy-proportional work |
Table 1. Decomposition of the announced reduction rates (back-calculated). Assumes a 5 MWh container baseline; BYD’s actual comparison baseline is not stated in the source and requires verification. Source: ESS News / pv magazine reporting (2026-09-16) figures + independent back-calculation.
Table 1 makes the point clearly: BMS and maintenance are domains dominated by unit count, so enlargement effects show through directly, but installation/commissioning is four-fifths tied to cell/energy count and cannot be touched by enlargement. If the goal is shortening the on-site schedule, automating or pre-completing cell-proportional work (SOC alignment, cell voltage scanning) at the factory before shipment has a far larger expected payoff than enlarging block size.
3. Comparison across configurations — doubling capacity again yields only a 10% additional reduction in commissioning
| Standard configuration | Power | Energy | Duration | Blocks per 1 GWh (calculated) | Unit-count reduction vs. baseline | Commissioning-labor reduction (back-calculated) |
|---|---|---|---|---|---|---|
| Baseline (assumed) | — | 5 MWh | — | 200 units | — | — |
| GC Block 2-hour | 7.5 MW | 15.5 MWh | 2 h | 64.5 blocks | 67.8% | ≈13.3% |
| GC Block 4-hour | 7.5 MW | 31 MWh | 4 h | 32.3 blocks | 83.9% | ≈16.5% |
| GC Block 6-hour | 10 MW | 62 MWh | 6 h | 16.1 blocks (BYD states ≈17) | 91.5% | ≈18.0% |
Table 2. Unit count and back-calculated commissioning-labor reduction by configuration. Applies a fixed unit-count-proportional share of 19.7%; entirely a hypothetical scenario. The discrepancy between the arithmetic value of 16.1 blocks and BYD’s stated “approximately 17 blocks” at 62 MWh (whether margin or auxiliary equipment is included) requires verification.
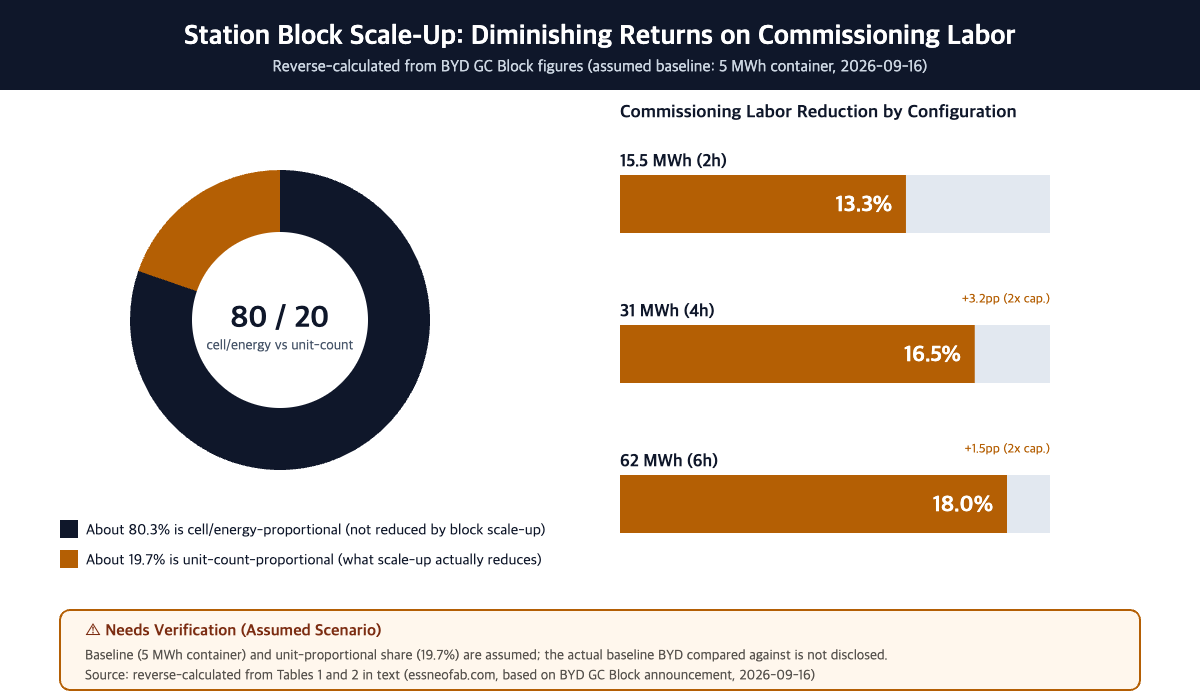
What Table 2 shows is not the absolute magnitude of the reduction but diminishing returns. Doubling capacity from 15.5 MWh to 31 MWh raises the commissioning-labor reduction from 13.3% to 16.5% — a gain of 3.2 percentage points. Doubling again from 31 MWh to 62 MWh raises it from 16.5% to 18.0% — a gain of only 1.5 percentage points. This is because the unit-count-proportional term is already nearly exhausted. Under this structure, enlarging blocks further for the sole purpose of reducing commissioning labor means buying ever-smaller gains against a theoretical ceiling of 19.7%.
Looking at cell count clarifies this further. Assuming a 1,980 Ah blade cell at an LFP nominal voltage of 3.2 V, each cell holds approximately 6.34 kWh, so a single 62 MWh block contains approximately 9,785 cells, and a full 1 GWh project contains approximately 157,800 cells. This figure of roughly 158,000 does not change no matter how the blocks are grouped. Table 1’s conclusion is that 80% of commissioning labor is tied to exactly this figure.
4. Same-week industry snapshot
China halts approval of new ESS battery factory permits (SCMP exclusive, 2026-09-11; domestic reports 2026-09-12) — Approvals for planned or not-yet-started projects since May 2026 are reportedly on hold via informal “window guidance.” Where capacity expansion can come from when the new-build route is blocked is addressed separately in another article in this issue.
OCP deploys 25 MW/125 MWh LFP BESS at a Moroccan phosphate mine (ESS News, 2026-09-16) — An example of an industrial offtaker directly deploying a large BESS; how site conditions (dust, high temperature) affect commissioning procedures requires separate review.
InfoLink forecasts 46.1 GWh in global residential ESS shipments for 2026 (ESS News, 2026-09-16) — By first-half shipment share, the top three are Fox ESS (11.5%), Sigenergy (11.3%), and Deye (11.0%). Residential systems have small per-unit capacity, making the unit-count-proportional term dominant — the opposite structure from this article’s case — and applying the same decomposition model yields the opposite conclusion.
5. Conclusion and implications
Station block enlargement delivers a large effect on BMS hierarchy consolidation and maintenance-round reduction, but only a limited effect on shortening on-site commissioning schedules. Back-calculating the three announced figures on a common basis makes this asymmetry visible. For a project whose schedule is gated by commissioning, it is therefore more rational to select suppliers based not on “how large is the block” but on “how much cell-proportional work is pre-completed at the factory before shipment.”
The layer this article addresses is on-site (field) installation and commissioning. An earlier article on merge-point synchronization between the pack assembly line and the in-house container shell fabrication line at the same site analyzed buffer and transfer problems where two upstream lines meet inside the factory; another earlier article on how grid-operator order allocation translates into pack-assembly-line load examined how order allocation is translated into line takt time. This article addresses a different layer: the point where those two articles leave off — the labor structure after a completed unit arrives on site.
That said, the quantitative results in this analysis depend entirely on the baseline assumption (5 MWh container). If BYD’s actual comparison baseline is its own first-generation solution, the unit-count reduction rate would be far smaller than 91.5%, and the back-calculated unit-count-proportional share of 19.7% would rise substantially. This article’s conclusion — that the asymmetry exists — holds regardless of the baseline, but the figure (approximately 20%) requires further verification.
FAQ
Q. Doesn’t a larger block increase transport and lifting constraints, potentially increasing on-site labor instead?
This is a valid counterargument. The total weight and external dimensions of a single 62 MWh block, and whether it is delivered to site as one piece or requires split delivery, are not confirmed in the public material (verification required). If split delivery followed by on-site assembly is required, the reduction in Term A (unit-proportional work) would be offset by new on-site assembly labor. In that case, the constraint simply relocates from commissioning to site access-road width, crane rated load, and foundation bearing capacity — it does not disappear. This article’s back-calculation assumes the block arrives as a complete unit; if that premise breaks down, the interpretation of the 18% reduction also changes.
Q. What is the 69.4% BMS complexity figure measured against?
The source material does not disclose the calculation method (verification required). Whether it counts management nodes, communication topics, or diagnostic parameters changes the meaning substantially, so this figure must not be compared to one’s own specifications without first confirming the unit of measurement.
Q. If cell-proportional work is pre-completed at the factory, does on-site labor actually decrease by that much?
Not entirely. Vibration and temperature history during post-shipment transport can disturb SOC alignment, requiring on-site re-verification. Still, even shifting from “100% inspection” to “sample verification” meaningfully reduces Term B. The magnitude of the reduction depends on transport conditions and cell specifications and requires empirical verification.
Field Application Notes
| Check | How to execute | Notes |
|---|---|---|
| Decompose past project commissioning labor into Term A and Term B | Extract labor input (man·h) per task from commissioning logs and classify each into only two categories: “repeats per unit” or “repeats per cell/module” | Document the classification criteria first; place mixed items in a separate third column and record only their proportion |
| Calculate your own A/(A+B) ratio | Use the decomposition above to compute your unit-count-proportional share and compare it against this article’s ~20% | If your figure exceeds 40%, block enlargement will have a larger effect for you than described here |
| Require suppliers to state their comparison baseline in proposals | For any “N% commissioning reduction” claim, formally request the comparison baseline configuration and unit of measurement | The meaning of the figure differs depending on whether the baseline is the supplier’s own first generation or an industry-standard container |
| Confirm the scope of cell-proportional work that can be pre-completed at the factory | Agree with the supplier on which of SOC alignment, cell voltage scanning, and sensing wiring verification can be completed before shipment | Also define the post-transport re-verification scope (100% vs. sample) — this is what determines actual effectiveness |
| Review site logistics constraints in advance | Before considering block enlargement, confirm access-road width, crane rated load, and foundation bearing capacity ahead of commissioning labor | If the constraint merely relocates, the enlargement benefit is offset |
Footnotes
[1] Interface: The boundary point where different pieces of equipment, systems, or organizations meet and where signals, materials, or responsibility are handed off.
[2] BESS (Battery Energy Storage System): A power storage facility that integrates battery, PCS, BMS, thermal management, and control into a single unit.
[3] Grid-forming: An inverter control method that autonomously establishes the grid’s voltage and frequency as a reference, as distinct from conventional grid-following control.
Sources
ESS News / pv magazine Global/USA, “BYD launches 62 MWh GC Block for gigawatt-scale battery storage plants” (2026-09-16). Prior-art references (no newly published patents within the past 30 days were found, so only general prior art is cited): US20170093156A1 (Scalable and flexible cell-based energy storage system), US20180366948A1 (Battery energy storage system), US11936222 (BMS architecture for energy storage).
Measurement/estimation conditions: The 5 MWh container baseline, 3.2 V nominal cell voltage, and the fixed application of the unit-count-proportional share are all assumed values. Actual results will vary with site conditions (ambient temperature, delivery access, workforce skill level) and require empirical verification. Lab-scale or demonstration-condition results are not equated 1:1 with production-line performance.
Related Reading
- Designing the Merge Point in a 10 GWh Pack-Container Integration Line: Synchronizing Two Upstream Lines and Sizing AGV Fleet from the Powertrac × Sunka Lead Order
- 128 MW of Distribution-Grid ESS Volume Allocated — Can the Battery Pack Assembly Line Absorb the Takt Time?
- Why three qualified products landed on the same duration — in DSX Ready BESS, sizing is set by the output axis


You May Also Like
45 Days from Pohang to Georgia — Safety Stock at an Intercontinental Cathode Interface Is Driven by Lead-Time Variability, Not Demand
A 160 MW battery’s six-week commissioning has two baselines
2 Comments
Pingback:
Pingback: