LS Electric Ships First Units of Next-Gen ESS PCS “G2” — Is Liquid Cooling the Answer?
Abstract
On August 5, 2026, LS ELECTRIC held a first-shipment ceremony at its Cheonan DC Factory for ‘G2’, its next-generation power conversion system (PCS) for ESS. The key change is a switch in cooling method from air cooling to liquid cooling, and the reported benefits are improved heat control and durability together with a reduced installation footprint. This article redefines the cooling method not as “stand-alone PCS efficiency” but as a system variable: “how much the output availability of an ESS site fluctuates by season.” It shows that, in an assumed scenario, the annual average output availability of an air-cooled PCS is 98.6 %, which makes the difference appear small, but in the high-temperature window where derating concentrates it drops to 80 %, so the annual average masks the seasonal deviation.
1. The Conclusion First — The Value of the Cooling Method Appears Not in the Annual Average but in the Output Floor of the High-Temperature Window
The practical benefit of switching the PCS cooling method lies not in improving annual average efficiency, but in preventing PCS output from falling below rating during the high-temperature window, when the value of electricity is highest.
Situation (S): The ESS market is growing on the back of AI data center power demand and the expanding deployment of renewable energy, and according to press reports the U.S. ESS market is projected to reach 600 GWh by 2030. Complication (C): Air-cooled PCS units have been subject to operation at reduced output (derating) due to thermal limits in summer, when intake air temperature rises, and G2 addresses this problem with liquid cooling. Question (Q): Why does derating, which amounts to a loss of only a few percent per year, become a system design variable? Answer (A): Because derating time is not distributed evenly across the year but is concentrated in specific seasons and time slots.
2. Facts — G2 and the Cheonan DC Factory
The facts that can be confirmed from public reports are as follows. Rated output, efficiency figures, and production capacity were not presented in the reports, so this article does not estimate them.
| Item | Reported content | Remarks |
|---|---|---|
| First shipment | August 5, 2026, shipment ceremony at the Cheonan DC Factory | Entered mass production on a dedicated production line |
| Cooling method | Liquid cooling technology applied | Improved heat control and durability versus air cooling |
| Structure | Compact structure, reduced installation footprint | Supports battery-integrated ESS configurations |
| Production site | 100 % direct current (DC) distribution factory | DC distribution operation improves overall factory energy efficiency by 10 % or more (company statement) |
| Rating, efficiency, production capacity | Not disclosed | verification required |
It is symbolic that a PCS, whose core function is AC-DC conversion, is produced in a DC-distribution factory. However, it should be noted that the 10 % improvement in factory energy efficiency is a metric of the production site and is a figure separate from the conversion efficiency of the shipped PCS.
3. Mechanism — Derating Disappears in the Annual Average and Appears at the Peak
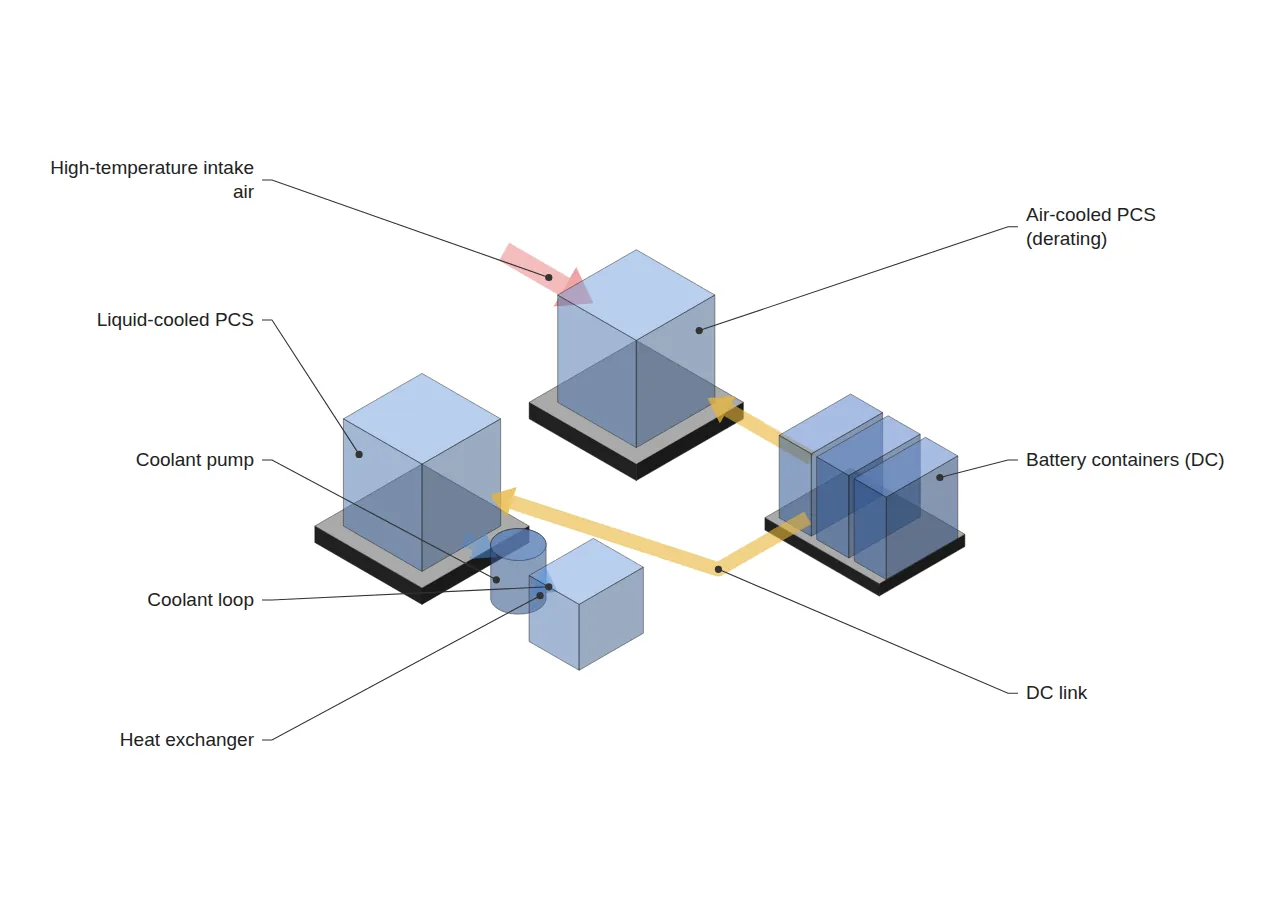
If the output availability[1] of an ESS site is defined as “the proportion of time during which rated output can be delivered,” high-temperature derating of an air-cooled PCS directly erodes this metric. The following is an assumed scenario intended to illustrate this structure and is unrelated to the actual derating characteristics of G2 or competing products.
| Category | Air-cooled (assumed) | Liquid-cooled (assumed) |
|---|---|---|
| Annual operable time | 31,536,000 s | 31,536,000 s |
| Derating time | 2,160,000 s (high-temperature window) | 0 s |
| Output during derating | 80 % of rating | 100 % of rating |
| Annual average output availability | 98.6 % | 100 % |
| Output availability in high-temperature window | 80.0 % | 100 % |
On an annual average basis the difference is 1.4 %p, which appears small for the effect of a single controlled variable. However, when the high-temperature window is isolated, the difference widens to 20 %p. Because the high-temperature window is likely to coincide with periods when cooling loads raise both grid demand and electricity prices, system designers should adopt the output floor of this window, not the annual average, as the baseline.
Securing the same floor while retaining air cooling requires over-design by enlarging the PCS rating. Under the assumed conditions, guaranteeing 100 MW in the high-temperature window requires an air-cooled PCS rating of 100 ÷ 0.8 = 125 MW, which leads to accompanying increases in PCS quantity, installation footprint, and grid-connection equipment. The reported “reduced installation footprint” of liquid cooling can be read as an effect in the same direction as avoiding this over-design.
4. Limits of Application from a Line and System Perspective
Liquid cooling is not free. Because a new auxiliary system—the coolant circulation loop (pump, heat exchanger, piping)—is connected in series with the PCS, a new availability loss path is created in which a cooling-system failure leads directly to a PCS stop. In other words, derating losses are reduced at the cost of adding the auxiliary-equipment failure rate as a variable, and the net effect of the two can be determined only with field data.
In addition, the derating time of 2,160,000 s and the 80 % output are assumed values of this article. Actual values vary considerably with the climate of the installation site, the container HVAC design, and the thermal design margin of the PCS, and lab test or single-site results must not be applied 1:1 to other sites (further verification required).
This differs in focus from BMS, PCS, EMS: Why Do the Three ESS System Layers Move at Different Speeds?, which dealt with differences in response speed across the three layers of BMS, PCS, and EMS. Whereas that article addressed the time scales between control layers, this article addresses the impact of the thermal constraints of PCS hardware on site output availability.
5. Conclusions and Implications
G2’s switch to liquid cooling goes beyond an improvement of the stand-alone PCS; it forces ESS site design to re-establish a baseline called the “output floor in the high-temperature window.” Comparing cooling methods by annual average output availability alone may miss a meaningful difference. Conversely, when liquid cooling is adopted, the failure modes of the cooling system itself must be included in the availability calculation. Once product specifications such as rating and efficiency are disclosed, this article plans to replace the assumed scenario with actual values and re-verify.
FAQ
Q. If the annual average difference is 1.4 %p, isn’t it negligible?
A. It is, if only annual energy loss is considered. However, the revenue and grid contribution of an ESS carry different values by time slot, and derating concentrates in the high-value high-temperature window. The basis of comparison should therefore be not the annual average but the output floor of the high-temperature window (80 % versus 100 % in the assumed scenario).
Q. Does liquid cooling always increase availability?
A. No. Because the coolant circulation loop is added in series with the PCS, pump and piping failures become new causes of stoppage. The net effect can be judged only by comparing, with field measurements, the reduction in derating against the added auxiliary-equipment failures.
Field Application Notes
| Check | How to execute | Remarks |
|---|---|---|
| ☐ Extract PCS derating history | Aggregate PCS output-limitation events at operating sites, in s, together with intake air temperature | Separate by month and time slot, not by annual average |
| ☐ Calculate output floor in high-temperature window | Calculate the floor ratio as minimum output in derating periods ÷ rating | Compare against contractual output guarantee conditions |
| ☐ Compare over-design cost | Calculate the additional PCS rating required to guarantee the floor (rating ÷ floor ratio) | Compare with the cost of switching to liquid cooling |
| ☐ Register cooling-system failure modes | When adopting liquid cooling, add pump, heat exchanger, and leak detection as separate availability loss codes | Record separately from PCS failures |
Footnotes
[1] Output availability (Power Availability, as defined in this article): the time-weighted proportion of the analysis period during which the PCS was able to deliver rated output. It is an operating metric used only in this article and differs from the availability factor of OEE (Overall Equipment Effectiveness = Availability × Performance × Quality).
Sources: LS ELECTRIC ships first ‘G2’ next-gen ESS PCS (Herald Business, 2026-08-06, https://biz.heraldcorp.com/article/10832348) / LS ELECTRIC makes first ESS PCS shipment, targeting AIDC demand (ZDNet Korea, 2026-08-06, https://zdnet.co.kr/view/?no=20260806090430) / LS ELECTRIC makes first shipment of ‘G2’ ESS PCS, ramps up mass production at Cheonan DC Factory (HelloT, https://www.hellot.net/news/article.html?no=114199)
Measurement & Calculation Conditions: (The body text was supplemented on 2026-09-23.) Annual operable time of 31,536,000 s (365 days × 86,400 s), air-cooled derating time of 2,160,000 s, output during derating of 80 % of rating, and liquid-cooled derating of 0 s are all assumed values for structural illustration, not field measurements of any specific product or site. Field verification is required.
Related reading — Between the Battery Rack and the PCS: Two Points Where the Interface Diverges · BMS, PCS, EMS: Why Do the Three ESS System Layers Move at Different Speeds?


You May Also Like
After Korea’s Battery History Management System: IDs Continue, Operating History Breaks — History Continuity of ESS Reuse Racks
K-BATTERY SHOW 2026 Fire Safety Seminar: What to Look for in a Line-Level Fire Response System
One Comment
Pingback: