본문으로 바로가기
Ess-neofab

A line- and system-level record of ESS and secondary-battery manufacturing processes

  • 한국어
  • English
  • Home
  • Process
  • System
  • Interface
  • Traceability
  • News & Trends
  • About
  • Contact
  • 한국어
  • English
  • Home
  • Process
  • System
  • Interface
  • Traceability
  • News & Trends
  • About
  • Contact

카테고리

  • Interface (28)
  • News & Trends (20)
  • Process (32)
  • System (31)
  • Traceability (22)

최근 글

  • Five million ACC cells equal 2.7 to 3.6 months of nameplate outputOctober 15, 2026
  • A 160 MW battery’s six-week commissioning has two baselinesOctober 8, 2026
  • Two Cycles a Day Take 106.8 % of a Day, and the Retention Tier Shifts Cell Volume by 1.47 GWhOctober 1, 2026
  • Battwoo’s Second-Life EV Batteries — When an 80 % Acceptance Threshold Overlaps the Retirement Distribution, Incoming Screening Becomes the BottleneckSeptember 30, 2026
  • US storage set an energy record in Q2 as installed power fell 7%September 29, 2026
  • CATL Starts Trial Production in Debrecen — The Digits of the Defect-Rate Target, Not the Equipment, Set the Length of a Trial RunSeptember 29, 2026
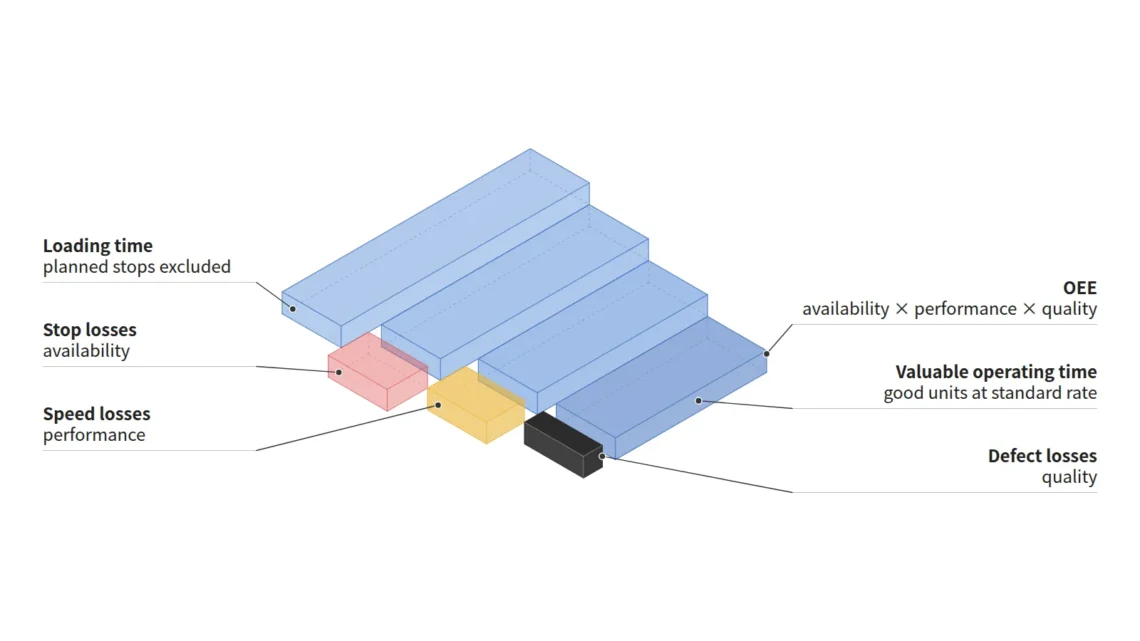
  • Isometric concept of translucent blocks stepping down from loading time through stop, speed and defect losses to valuable operating time
    Process,  System

    If Availability, Performance and Quality Are All 80 %, OEE Is 51.2 % — How to Calculate OEE

    September 25, 2026 /

    OEE (overall equipment effectiveness) is calculated as availability × performance × quality, and the Japan Institute of Plant Maintenance (JIPM) gives the example that when all three factors are 80 %, OEE is 51.2 %. When the three factors are multiplied as JIPM defines them, OEE is organized as "standard (planned) cycle time × number of good units ÷ loading time," that is, the share of loading time spent making good units at the standard speed. In an assumed shift (loading time 27,600 s, standard cycle time 32 s, 690 good units), availability is 90.0 %, performance 90.4 % and quality 98.3 %, giving an OEE of 80.0 %. If…

    read more
    ESS-neofab 2 Comments

    You May Also Like

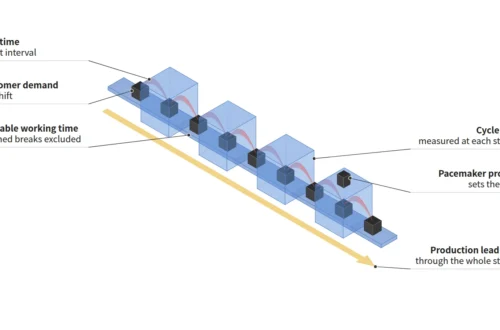
    Isometric concept of a line with products moving between stations at equal intervals, labeled takt time, cycle time and lead time

    Don’t Subtract Breakdowns When Calculating Takt Time — Takt Time vs. Cycle Time vs. Lead Time
    September 25, 2026
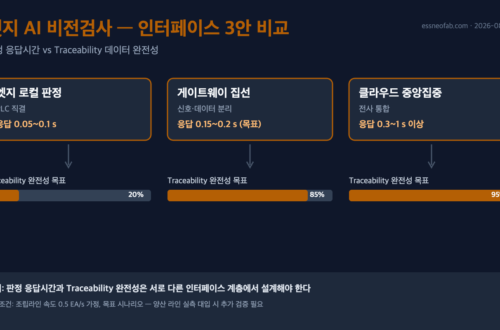
    엣지 AI 비전검사 인터페이스 3안 비교: 엣지 로컬 판정, 게이트웨이 집선, 클라우드 중앙집중의 응답시간과 Traceability 완전성 비교 도식

    Edge AI Vision Inspection and Battery-Pack Leak Testing: How Gateway Aggregation Affects Traceability Completeness
    August 27, 2026
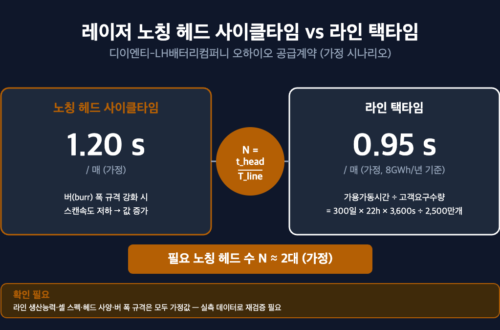
    레이저 노칭 헤드 사이클타임 1.20초와 라인 택타임 0.95초를 비교해 필요 헤드 수 2대를 도출한 도식

    The Interface Between Laser Notching Cycle Time and Line Takt Time — The Head-Count Sizing Problem Revealed by DI ENT’s Ohio Supply Contract
    September 7, 2026
© 2026 Ess-neofab · A line- and system-level record of ESS and secondary-battery manufacturing processes
  • About
  • Contact
  • Privacy Policy
  • Disclaimer
Ashe Theme by WP Royal.