Dry Electrode: Where Does the Line Bottleneck Move?
Abstract
Converting to a dry electrode process eliminates the drying-oven section of a wet-coating line, but the claim that this improvement, by itself, shortens line takt time does not hold. When both the physical length and the time buffer that the drying oven provided disappear at once, the bottleneck shifts to the electrode-formation/lamination section and the quality-inspection section, and the degrees of freedom available for buffer design actually shrink. Separately, an industrial-park zoning deregulation announced in August 2026 adds battery-recycling businesses to the eligible occupants of the Gumi and Pohang national industrial complexes, changing the logistics-interface conditions outside the line. This article examines both changes together at the line/system level, and takes a reserved position on applying pilot data directly to mass-production metrics.
1. The Conclusion First: Removing the Drying Oven Is Not a Takt-Time Improvement — It Is a Bottleneck Shift
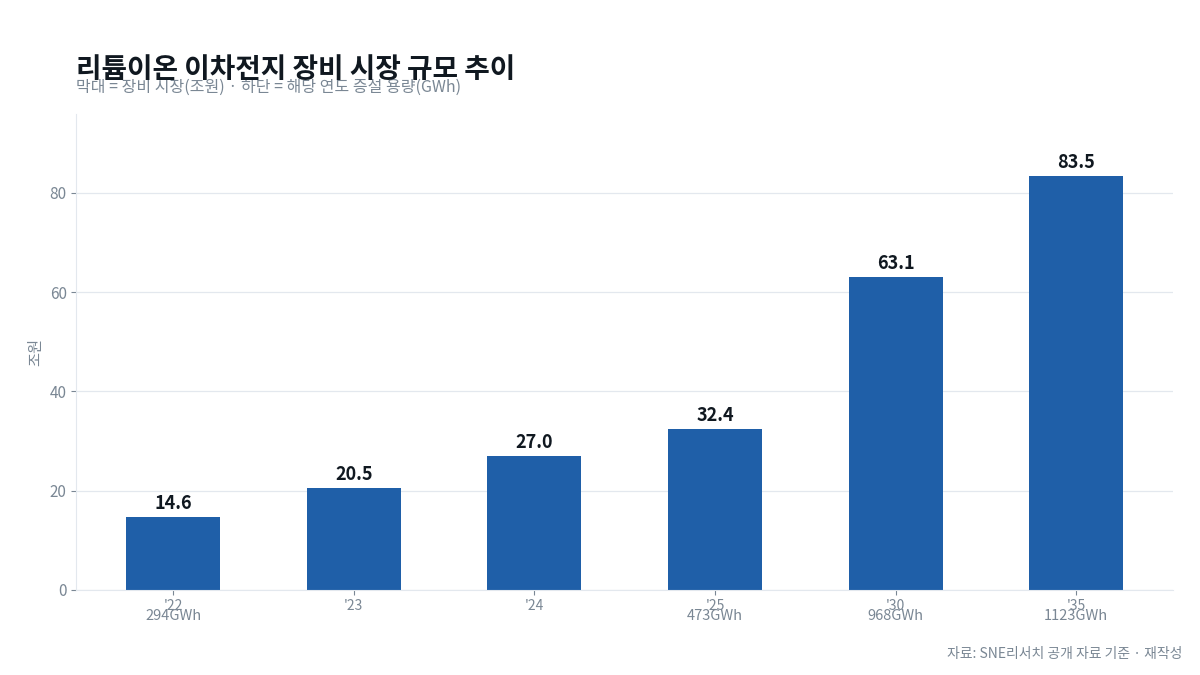
Situation. The battery manufacturing equipment market is in an expansion phase. Per SNE Research data, the market size is projected to grow from KRW 20.5 trillion in 2023 to KRW 63.1 trillion in 2030 and KRW 83.5 trillion in 2035. The same data presents capacity-expansion volume at 294 GWh in 2023, 473 GWh in 2025, 968 GWh in 2030, and 1,123 GWh in 2035, assuming roughly KRW 50 billion in capital investment per GWh (a projection, base year 2023).
Complication. However, a different institution calculates the same market differently. Reports citing a Korea Institute of Machinery and Materials study put the figure at KRW 14.5 trillion in 2022, KRW 17 trillion in 2023, rising to roughly KRW 50 trillion by 2030 at a 14% CAGR. The split between the KRW 63.1 trillion and KRW 50 trillion figures for 2030 is presumed to stem from differing definitions of equipment scope and differing assumed investment cost per GWh across institutions. In other words, using the market-size figure directly as grounds for a line-investment decision is a citation made without a controlled variable in place.
Question. What variable, then, can an equipment engineer actually control?
Answer. Line structure. Dry electrode technology is regarded as a technology that can “simplify the manufacturing process and reduce energy consumption,” and is introduced as applicable to solid-state battery manufacturing as well. However, process simplification does not equal a shorter takt time. This article fixes its metric definitions as follows: OEE = Availability × Performance × Quality, and Takt Time = Available Operating Time / Customer Required Quantity. Takt time is a target value determined by customer demand, not a measured value produced by the equipment. What shortens when the drying oven is removed is cycle time and lead time; takt time itself remains unchanged as long as demand does not change. When this distinction blurs, the wrong question keeps recurring: “We removed the drying oven — why didn’t output increase by that much?”
2. The Assumption This Article Breaks: “Remove the Drying Oven and the Line Gets Shorter and Easier to Balance”
A widely held assumption on the shop floor runs as follows: since the drying oven is the longest and most expensive section of a wet-coating line, removing it shortens the overall line length and lowers the difficulty of balancing along with it. This assumption is only half right.
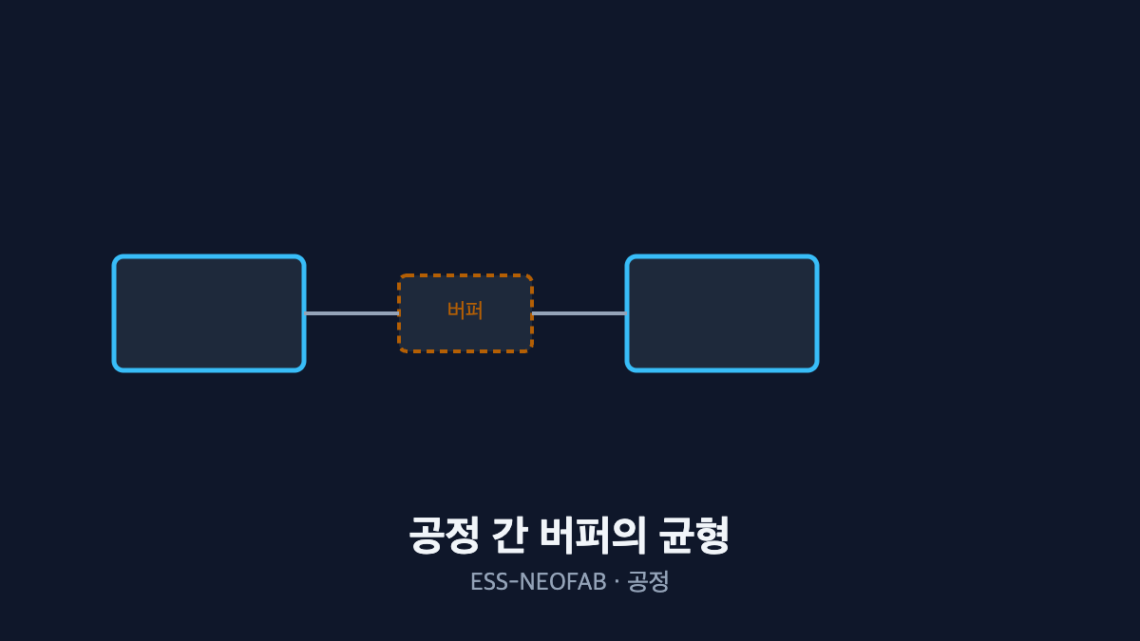
The drying oven occupies length while simultaneously functioning as a time buffer. At a given line speed (m/min), an oven section spanning tens of meters is itself an inline buffer holding work-in-process (WIP). Even when a short stoppage of a few to several tens of seconds occurs downstream, the WIP residing inside the oven delays the propagation of that downstream stoppage into a full line stop. Remove the drying oven, and this buffering disappears along with it.
The accurate way to describe dry-process conversion, therefore, is not “the line gets shorter” but “a long line with built-in buffering becomes a short line with none.” To secure the same Availability on the shortened line, the vanished inline buffer must be externalized as a separate accumulator or an inter-process stocker, which means reclaiming and reusing part of the length that was saved. The net reduction varies by each line’s failure-distribution profile and cannot be presented as a generalized figure.
3. Where the Bottleneck Moves: Three Grounds
Three grounds are presented for where the bottleneck moves upon dry-process conversion. Each is limited to the line-interconnection context and does not address the internal dynamics of individual equipment.
Ground 1: The disappearance of thermal buffering directly pressures the Availability factor. The Availability factor of OEE is determined by unplanned downtime. On a line where the inline buffer has disappeared, a short stoppage at a single downstream point is more likely to propagate into a simultaneous stoppage across the entire upstream section. This means Availability can fall even at an unchanged failure rate — and this is a problem of the Availability factor, not the Performance factor.
Ground 2: The relative weight of the inspection section increases. Once the drying section disappears, the share that the measurement/inspection section occupies within total cycle time rises. Inline measurement time that was previously absorbed within the drying-oven transit time is now fully exposed within the line’s overall cycle time. The inspection station’s processing time becomes a new balancing constraint.
Ground 3: Volume concentrates on the process with the highest entry barrier. SNE Research data assesses the electrode process as a “process with a higher entry barrier than other processes,” naming domestic equipment makers Yiseong F&C, TSI, Hanwha, PNT, and CIS. A high entry barrier means limited supply alternatives, which raises the likelihood that this section’s lead time becomes the critical path of the overall ramp-up schedule when a line is expanded. This is the point where a balancing problem extends beyond equipment layout into a procurement-scheduling problem.
Combining the three grounds, the bottleneck can be summarized as moving from “the removed drying oven” to “the unbuffered connection points and the inspection section.” However, the intensity of the bottleneck after the shift varies by line configuration, requiring measurement on each individual line.
4. Why Pilot Data Should Not Be Substituted as a Mass-Production Metric
Publicly available material on dry electrodes is largely based on results from the pilot or prototype stage. For solid-state batteries as well, Samsung SDI’s successful prototype production has been reported, with related equipment makers introduced as still developing key equipment. Numerous uncontrolled variables exist between the prototype stage and a mass-production line.
Pilot lines generally operate under single-lane, low-speed, short-continuous-run conditions. Quality-factor figures produced under these conditions do not include drift over long continuous runs, planned stoppages for roll changes and material replacement, or lane-to-lane variance across multiple lanes. Using pilot OEE as a predictor of mass-production OEE is therefore an unjustified extrapolation between values obtained under different sample conditions.
This article’s position is as follows: the direction of dry electrode’s process simplification and energy savings is confirmed by public material, but the magnitude to which that effect is reflected in a specific mass-production line’s OEE and unit cost requires additional verification on that line. At this point, there is no confirmed basis for asserting a specific quantitative improvement.
5. What the Recycling-Zoning Deregulation Changes Is Not the Line — It Is the Interface
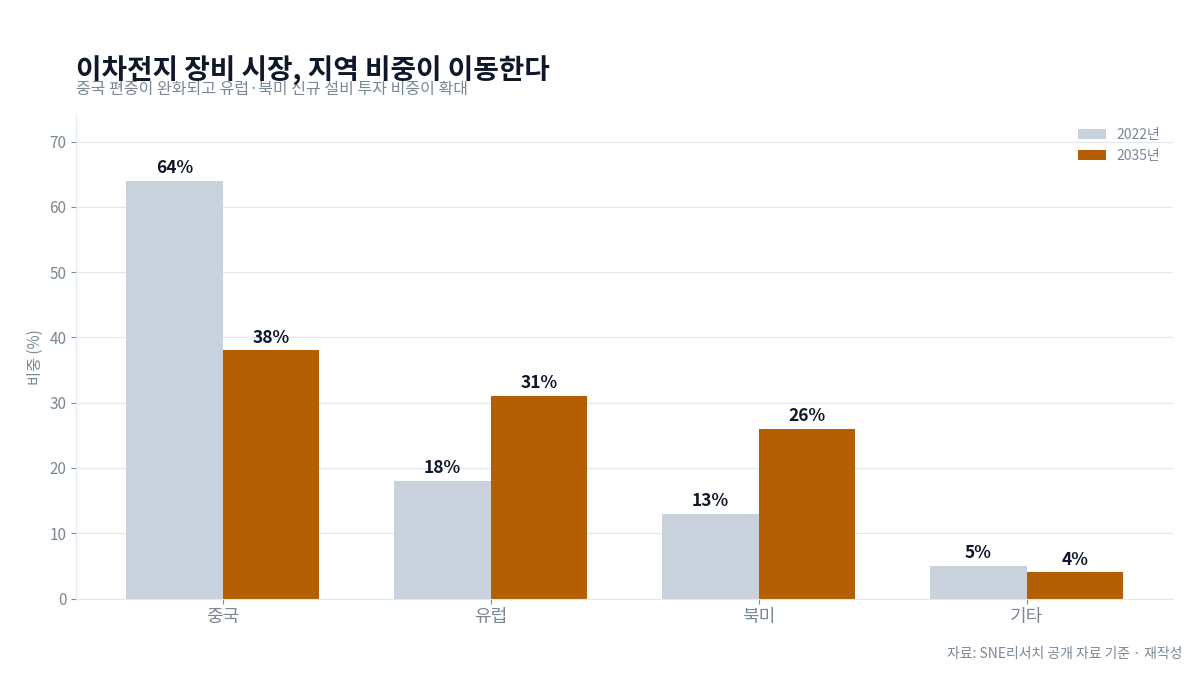
The regional-share outlook is background context for this discussion. Per SNE Research data, China’s share is projected to narrow from 64% in 2022 to 38% in 2035, while Europe expands from 18% to 31% and North America from 13% to 26% (a projection, base year 2022). From a domestic-line perspective, the significance of this shift is not export opportunity but a reconfiguration of material-recovery logistics. As the share of local production in Europe and North America grows, the points of origin for scrap and end-of-life cells become more dispersed, making the inbound-volume stability of domestic recycling facilities correspondingly harder to predict. However, this connection is not grounded in data that confirms a quantitative relationship between market share and logistics flow, and is held as an interpretation requiring additional verification.
The corporate-investment and innovation support measures announced by the government in August 2026 include a provision allowing battery-recycling businesses to occupy the Gumi and Pohang national industrial complexes. This improves on the previous situation, in which such businesses were classified under waste-related industries and restricted from occupying industrial complexes, by adding resource-recycling manufacturing for lithium, nickel, cobalt, manganese, and graphite to the list of eligible occupants. The new investment expected to be induced through this is approximately KRW 100 billion over 2026–2027 (an estimate per the government announcement).
The investment-inducement effect of the overall package was announced at approximately KRW 4.2 trillion, though some outlets reported KRW 4.3 trillion. Since the government’s own announcement specifies that the figure is “a mix of new investment and the early execution of existing investment,” this number is not a net-new investment amount. Stating the comparison baseline: the battery-sector share of KRW 100 billion corresponds to roughly 2.4% of the total, a small amount compared with the Yongin semiconductor cluster (approximately KRW 2.5 trillion), the Ochang bio sector (approximately KRW 530 billion), and semiconductor materials/parts/equipment (approximately KRW 800 billion). The implication is clear: this measure should be read as a change in siting conditions, not a change in investment scale.
The change with system-level significance is as follows. Once resource-recycling processes can be located within the same industrial complex as cell-manufacturing lines, the pathway for externally shipping process scrap and defective electrodes shortens. Dry electrode lines carry a lower solvent-recovery-system load than wet lines, but the disposal pathway for electrode scrap generated during the initial stabilization period is directly linked to line utilization. If scrap shipment is delayed, temporary in-line storage increases, which in turn encroaches on buffer space. Securing a resource-recycling operation within the industrial complex is a condition that can shorten this shipment interface’s lead time. However, the actual magnitude of lead-time reduction depends on when the facility begins operating and its processing capacity, and is not confirmed at this point.
For reference, PNT — one of the electrode-process equipment makers — disclosed H1 2026 results of KRW 219.0 billion in revenue, KRW 12.5 billion in operating profit, and KRW 27.1 billion in net income (Q2 revenue of KRW 117.6 billion, operating profit of KRW 3.7 billion). This is an indicator of the direction of equipment demand, but since the share of revenue specific to the dry process is not confirmed in the disclosed data, it cannot be used as evidence of dry-conversion progress.
FAQ
Q1. Doesn’t switching to dry electrodes reduce line investment cost?
The investment cost for the drying oven and its associated heat-source and exhaust equipment does decrease. However, this must be booked together with the accumulator needed to replace the vanished inline buffer, additional inspection stations, and the lost volume during the initial ramp-up period. The net change in investment cost requires a line-by-line calculation, and there is no basis for presenting a generalized savings rate.
Q2. (Anticipated rebuttal) Isn’t it an exaggeration to say the drying oven acts as a buffer? The actual buffer is the accumulator; the drying oven is just process equipment.
The objection that the drying oven is not, by design intent, a buffer device is valid. This article’s claim is limited to functional equivalence. As long as the oven section retains WIP in transit, the delay in upstream/downstream stoppage propagation caused by that dwell time occurs regardless of design intent. Therefore, if the accumulator capacity is kept the same as before when the drying oven is removed, the line’s overall stoppage-propagation characteristics may show a statistically meaningful difference from before. The magnitude of this difference depends on each line’s short-stoppage frequency distribution, and is not asserted without measurement.
Q3. Why draw such a strict distinction between takt time and cycle time?
Conflating the two metrics distorts the improvement target. Takt time is the target cycle derived from demand; cycle time is the line’s actual output cycle. What dry-process conversion improves is cycle time and lead time; takt time remains the same as long as demand does not change. Calling the target and the actual result by the same name erases the very standard needed to judge whether a balancing improvement has succeeded.
Q4. Should the recycling-zoning deregulation be reflected in line design right now?
It is too early for a design change. What is confirmed at this point is only the institutional condition of eligibility for occupancy and roughly KRW 100 billion in expected new investment; the operating timeline and capacity of actual processing facilities are not confirmed. What should be reflected is not a design, but a scenario — it is appropriate to calculate storage-space requirements separately for the case where scrap-shipment lead time shortens and the case where it does not.
Field Application Notes
Limited to items executable this week. Every item can be started with existing data and personnel, with no new investment required.
| # | Action Item | Owner | Deliverable | Duration |
|---|---|---|---|---|
| 1 | Re-tabulate the OEE three-factor breakdown: split the last 12 weeks of data into Availability, Performance, and Quality, distinguishing planned from unplanned downtime | Process Engineering | 12-week OEE breakdown table | 2 days |
| 2 | Extract short-stoppage logs: tabulate the location and frequency of stoppages under 60 s by section | Maintenance | Section-by-section short-stoppage heat map | 2 days |
| 3 | Calculate inline WIP volume: quantify the current in-transit WIP using drying-section transit time and line speed (m/min) to determine actual buffer capacity | Process Design | Section-by-section WIP calculation report | 1 day |
| 4 | Simulate stoppage propagation: using the results of items 2 and 3 as inputs, estimate the line’s stoppage-propagation frequency when the drying-section WIP is set to zero | Process Design | Propagation-scenario comparison table | 3 days |
| 5 | Measure inspection-station processing time: measure per-station processing time (s) in the measurement section using a sample of 100 or more sheets | Quality | Inspection-section cycle-time distribution | 2 days |
| 6 | Begin logging scrap-shipment lead time: record, on a daily basis, elapsed time from generation to completed off-site shipment, along with storage area | Logistics | Shipment lead-time baseline | Ongoing |
| 7 | Issue a unified metric-definition notice: document the definitions of takt time, cycle time, FPY, and OEE and share across all departments | Process Engineering | One-page metric definition sheet | 0.5 days |
Items 1 through 5 are intended to secure the baseline needed when reviewing a dry-process conversion, and can be used as-is to improve the current line’s balancing regardless of whether conversion proceeds. Item 6 is a preliminary measurement for later quantitatively evaluating the effect of the logistics-interface change discussed in Section 5. Without a prior baseline, the magnitude of improvement after the institutional change cannot be verified as a controlled variable.
Summary of Cited-Figure Conditions
- Battery manufacturing equipment market: KRW 20.5 trillion (2023) → KRW 63.1 trillion (2030) → KRW 83.5 trillion (2035): SNE Research data, projection, assumes roughly KRW 50 billion investment per GWh.
- Same market: KRW 14.5 trillion (2022) → KRW 17 trillion (2023) → roughly KRW 50 trillion (2030), 14% CAGR: reported citing a Korea Institute of Machinery and Materials study. Scope of calculation differs from the SNE Research figures above; not directly comparable.
- Capacity expansion: 294 GWh (2023) → 473 GWh (2025) → 968 GWh (2030) → 1,123 GWh (2035): SNE Research data, projection.
- Gumi/Pohang recycling new investment approximately KRW 100 billion (2026–2027), total investment-inducement effect approximately KRW 4.2 trillion: an estimate per the August 2026 government announcement, a mix of new investment and early execution of existing investment.
- PNT H1 2026 revenue KRW 219.0 billion, operating profit KRW 12.5 billion, net income KRW 27.1 billion: per disclosure.
Related Reading
- LFP High-Compaction-Density Conversion and the Calendering Interface: How Nip Pressure and Line Speed Affect Takt Time
- Converting EV Lines to ESS: Where Does OEE Break Down?
- Inter-Process Buffers: Bigger Isn’t Always Better


You May Also Like
LS Electric Ships First Units of Next-Gen ESS PCS “G2” — Is Liquid Cooling the Answer?
DY Duckyang’s 10 MWh-Class Marine ESS — What the Water-Cooled Demonstration Means for System Design
2 Comments
Pingback:
Pingback: