본문으로 바로가기
Ess-neofab

A line- and system-level record of ESS and secondary-battery manufacturing processes

  • 한국어
  • English
  • Home
  • Process
  • System
  • Interface
  • Traceability
  • News & Trends
  • About
  • Contact
  • 한국어
  • English
  • Home
  • Process
  • System
  • Interface
  • Traceability
  • News & Trends
  • About
  • Contact

카테고리

  • Interface (28)
  • News & Trends (20)
  • Process (32)
  • System (31)
  • Traceability (22)

최근 글

  • Five million ACC cells equal 2.7 to 3.6 months of nameplate outputOctober 15, 2026
  • A 160 MW battery’s six-week commissioning has two baselinesOctober 8, 2026
  • Two Cycles a Day Take 106.8 % of a Day, and the Retention Tier Shifts Cell Volume by 1.47 GWhOctober 1, 2026
  • Battwoo’s Second-Life EV Batteries — When an 80 % Acceptance Threshold Overlaps the Retirement Distribution, Incoming Screening Becomes the BottleneckSeptember 30, 2026
  • US storage set an energy record in Q2 as installed power fell 7%September 29, 2026
  • CATL Starts Trial Production in Debrecen — The Digits of the Defect-Rate Target, Not the Equipment, Set the Length of a Trial RunSeptember 29, 2026
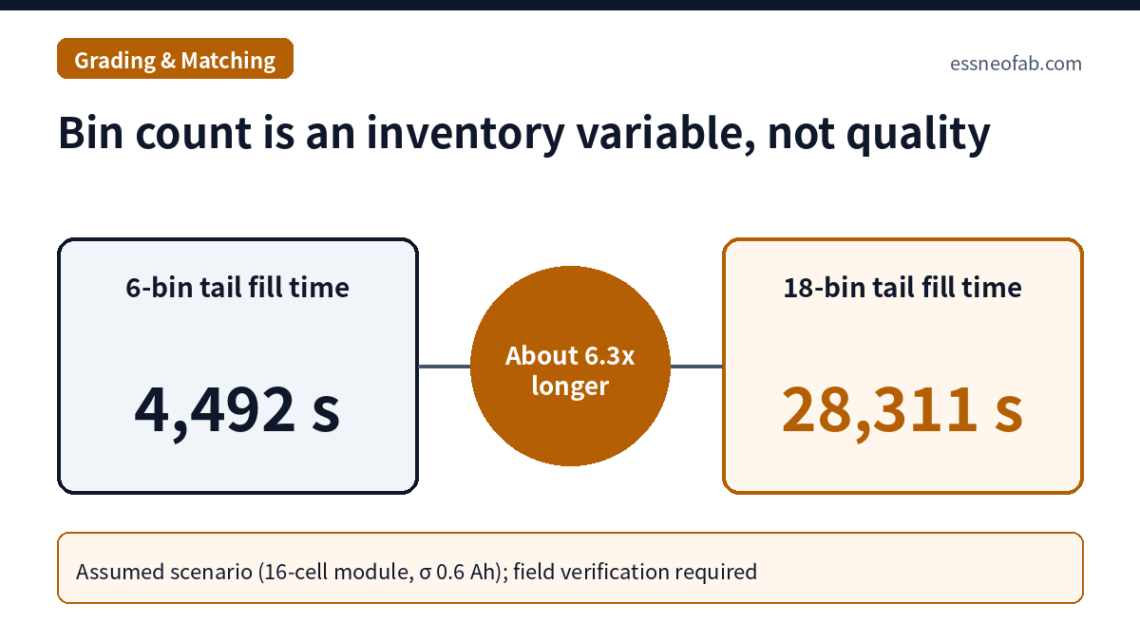
  • Bin count is an inventory variable, not quality
    Process,  Traceability

    Cell Grading Bin Count and Grade-Specific WIP: What Module Matching History Must Retain

    July 12, 2026 /

    Increasing the number of cell grading bins reduces within-module capacity spread in proportion to bin width, but grade-specific waiting WIP rises in proportion to bin count, and the time for the rarest tail bin to fill one module's worth of cells rises faster still. On an assumed line of about 4.46 million cells per year with 16-cell modules, going from 6 bins to 18 bins (6 capacity × 3 internal resistance) leaves the 0.6 Ah capacity bin width unchanged while raising average partial-fill WIP from 45 to 135 cells and tail-bin fill time from about 4,492 s to about 28,311 s. During ramp-up (operating at 30% of rated rate) this…

    read more
    ESS-neofab Comments Off on Cell Grading Bin Count and Grade-Specific WIP: What Module Matching History Must Retain

    You May Also Like

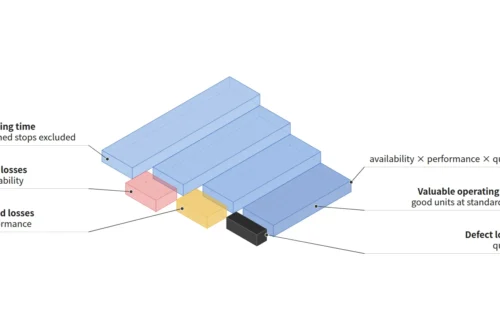
    Isometric concept of translucent blocks stepping down from loading time through stop, speed and defect losses to valuable operating time

    If Availability, Performance and Quality Are All 80 %, OEE Is 51.2 % — How to Calculate OEE
    September 25, 2026
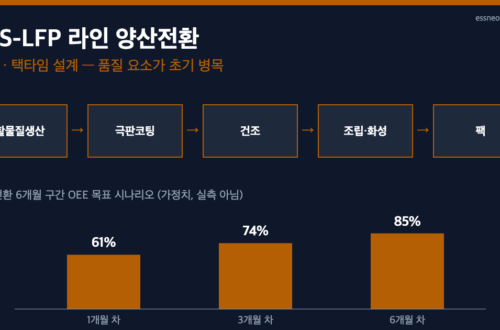
    ESS-LFP 라인 5단 공정 흐름과 양산전환 6개월 구간 OEE 목표 시나리오(1개월 61%, 3개월 74%, 6개월 85%) 도식

    The Equipment Maker’s Line-Ownership Shift — OEE and Takt-Time Design During the ESS-LFP New-Line Mass-Production Ramp-Up
    August 23, 2026
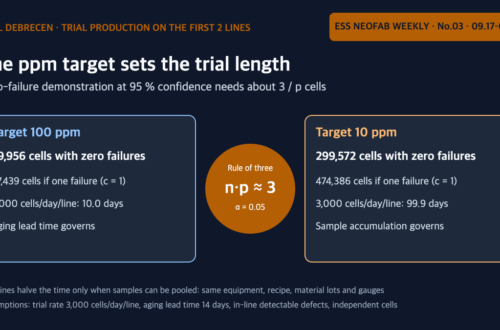
    CATL 데브레첸 시험생산에서 목표 불량률 100 ppm과 10 ppm의 무고장 입증 표본 수와 시험생산 기간 비교 도식

    CATL Starts Trial Production in Debrecen — The Digits of the Defect-Rate Target, Not the Equipment, Set the Length of a Trial Run
    September 29, 2026
© 2026 Ess-neofab · A line- and system-level record of ESS and secondary-battery manufacturing processes
  • About
  • Contact
  • Privacy Policy
  • Disclaimer
Ashe Theme by WP Royal.