본문으로 바로가기
Ess-neofab

A line- and system-level record of ESS and secondary-battery manufacturing processes

  • 한국어
  • English
  • Home
  • Process
  • System
  • Interface
  • Traceability
  • News & Trends
  • About
  • Contact
  • 한국어
  • English
  • Home
  • Process
  • System
  • Interface
  • Traceability
  • News & Trends
  • About
  • Contact

카테고리

  • Interface (28)
  • News & Trends (20)
  • Process (32)
  • System (31)
  • Traceability (22)

최근 글

  • Five million ACC cells equal 2.7 to 3.6 months of nameplate outputOctober 15, 2026
  • A 160 MW battery’s six-week commissioning has two baselinesOctober 8, 2026
  • Two Cycles a Day Take 106.8 % of a Day, and the Retention Tier Shifts Cell Volume by 1.47 GWhOctober 1, 2026
  • Battwoo’s Second-Life EV Batteries — When an 80 % Acceptance Threshold Overlaps the Retirement Distribution, Incoming Screening Becomes the BottleneckSeptember 30, 2026
  • US storage set an energy record in Q2 as installed power fell 7%September 29, 2026
  • CATL Starts Trial Production in Debrecen — The Digits of the Defect-Rate Target, Not the Equipment, Set the Length of a Trial RunSeptember 29, 2026
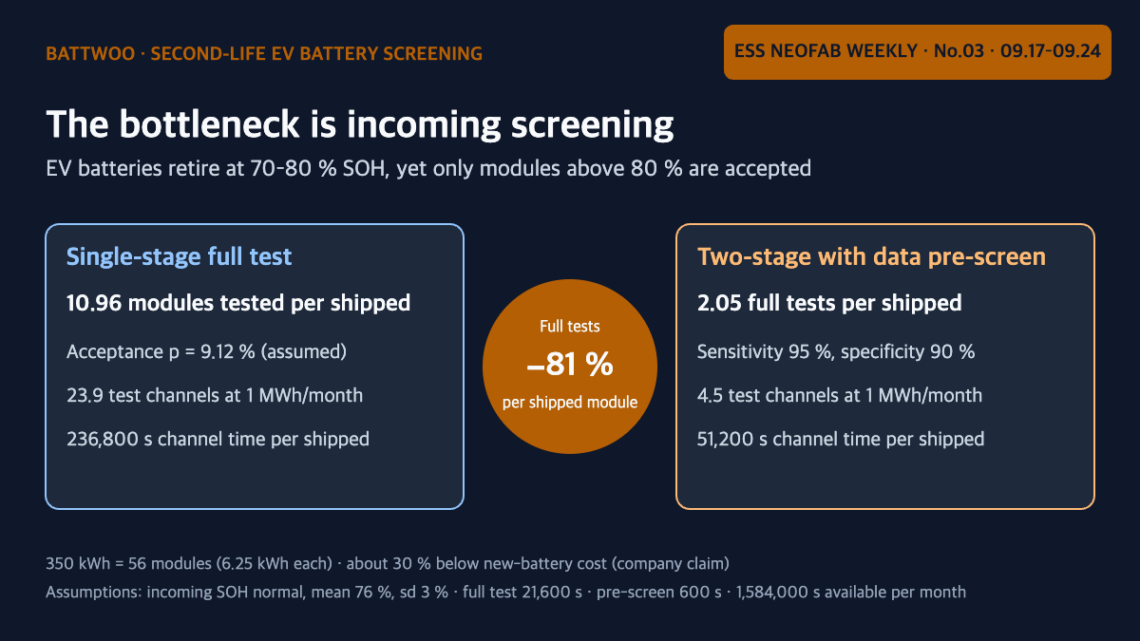
  • EV 재사용 배터리 선별 공정에서 단일 전수 시험과 데이터 기반 2단 선별의 출하 모듈당 시험 수와 채널 수 비교 도식
    Process,  Traceability

    Battwoo’s Second-Life EV Batteries — When an 80 % Acceptance Threshold Overlaps the Retirement Distribution, Incoming Screening Becomes the Bottleneck

    September 30, 2026 /

    French startup Battwoo refurbishes into stationary ESS only those retired EV batteries that retain more than 80 % of their capacity, while EV batteries typically retire at 70–80 %, and it says a 500 kWh system costs about 30 % less than one built with new batteries¹. When the retirement distribution and the acceptance threshold overlap like this, the acceptance rate is low: assuming incoming SOH with a mean of 76 % and a standard deviation of 3 %, the acceptance rate is 9.1 %, so 11.0 modules must be tested for every module shipped. At an assumed 1 MWh per month of shipments, 23.9 full-capacity test channels are needed,…

    read more
    ESS-neofab 0 Comments

    You May Also Like

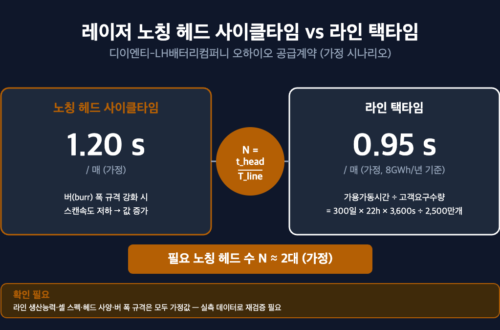
    레이저 노칭 헤드 사이클타임 1.20초와 라인 택타임 0.95초를 비교해 필요 헤드 수 2대를 도출한 도식

    The Interface Between Laser Notching Cycle Time and Line Takt Time — The Head-Count Sizing Problem Revealed by DI ENT’s Ohio Supply Contract
    September 7, 2026
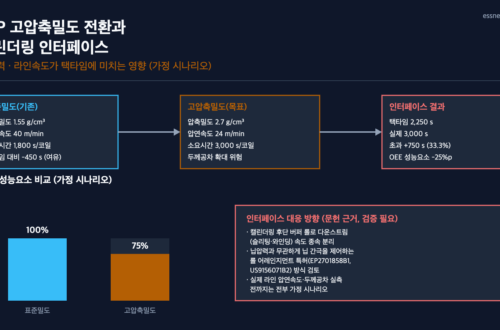
    LFP 고압축밀도 전환 시 캘린더링 닙압력·라인속도 인터페이스와 택타임·OEE 영향 시나리오 도식

    LFP High-Compaction-Density Conversion and the Calendering Interface: How Nip Pressure and Line Speed Affect Takt Time
    September 1, 2026
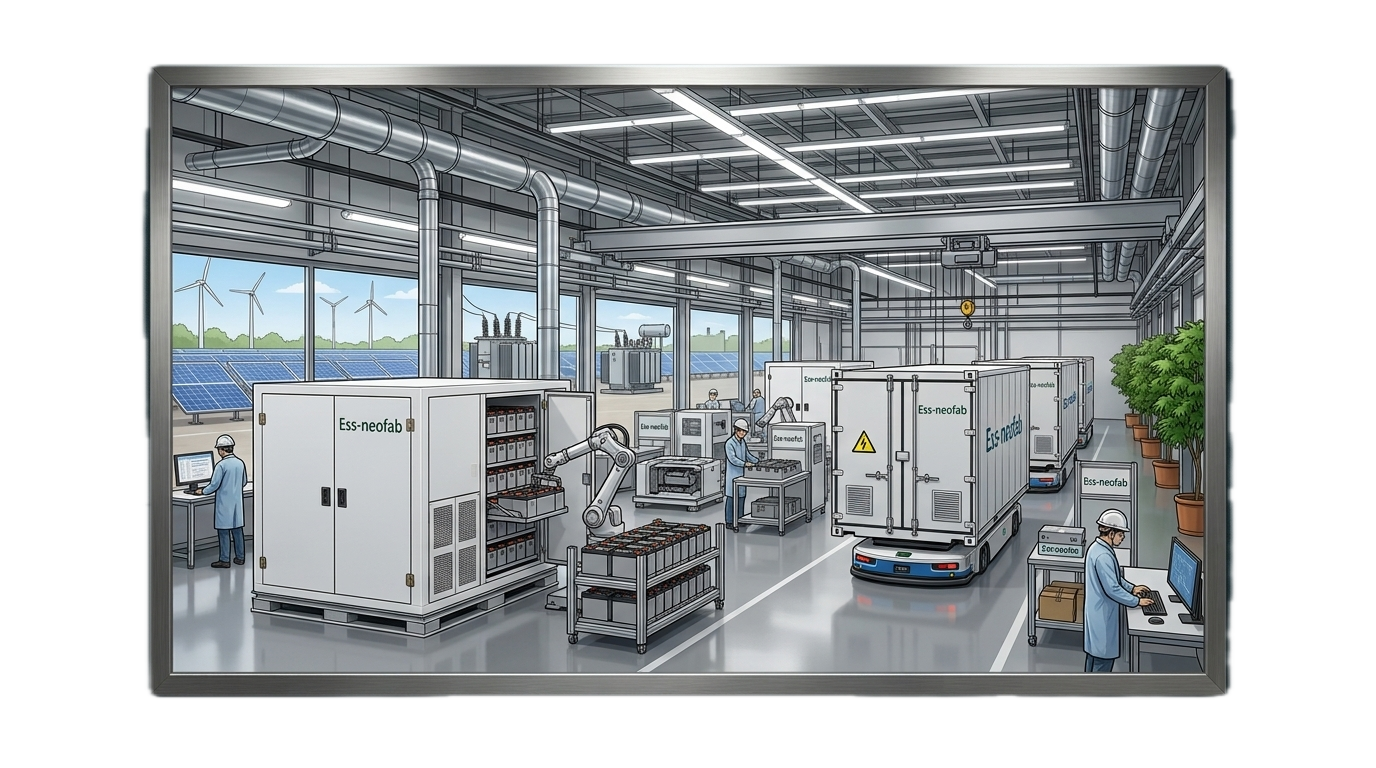
    배터리 ESS 제조 라인 전경

    Market Trends from a Battery Process/Equipment Perspective — 46-Phi Ramp-Up, Dry Process, Equipment In-Housing

    July 11, 2026
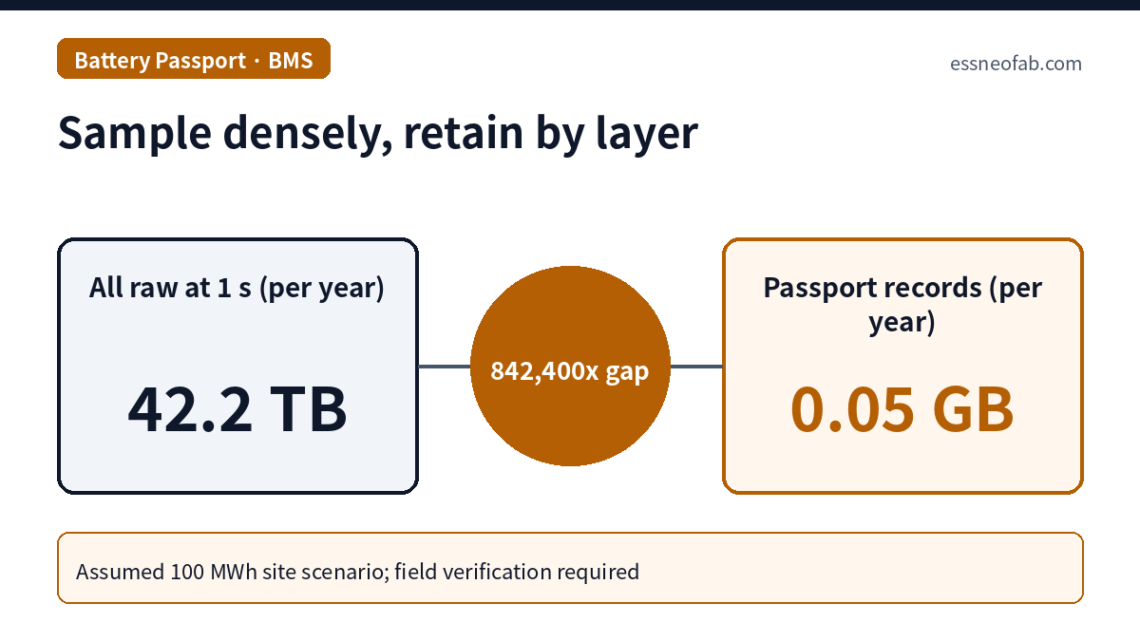
  • Sample densely, retain by layer
    System,  Traceability

    Linking BMS Operating History to the Battery Passport: Why Sampling and Retention Must Be Separated

    July 9, 2026 /

    When the dynamic BMS data required by Article 14 and Annex VII of the EU Battery Regulation (Regulation (EU) 2023/1542) is linked to the battery passport[1], the variable that determines data volume is not the sampling period but which layer retains what. At a site of roughly 100 MWh (111,488 cells, assumed), retaining all raw cell data at 1 s accumulates 42.2 TB per year and 421.9 TB over 10 years, whereas aggregating the Annex VII parameters into daily rack-level records yields about 0.05 GB per year, roughly 1/840,000 of that. Conversely, sampling a 20 s abnormal event at a 60 s period drops the detection probability to 33.3%. A…

    read more
    ESS-neofab Comments Off on Linking BMS Operating History to the Battery Passport: Why Sampling and Retention Must Be Separated

    You May Also Like

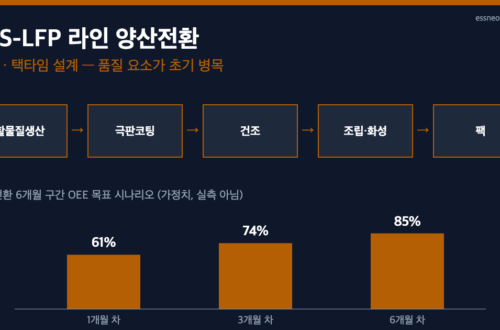
    ESS-LFP 라인 5단 공정 흐름과 양산전환 6개월 구간 OEE 목표 시나리오(1개월 61%, 3개월 74%, 6개월 85%) 도식

    The Equipment Maker’s Line-Ownership Shift — OEE and Takt-Time Design During the ESS-LFP New-Line Mass-Production Ramp-Up
    August 23, 2026
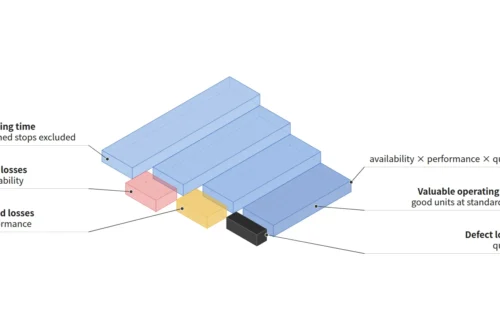
    Isometric concept of translucent blocks stepping down from loading time through stop, speed and defect losses to valuable operating time

    If Availability, Performance and Quality Are All 80 %, OEE Is 51.2 % — How to Calculate OEE
    September 25, 2026
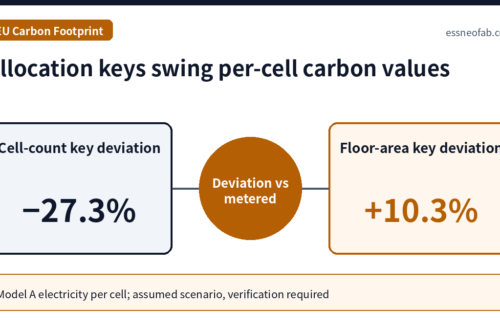
    Allocation keys swing per-cell carbon values

    EU Battery Carbon Footprint Methodology Still Pending: How Line Energy Metering Resolution and Allocation Choice Shift Per-Cell Values
    July 8, 2026
© 2026 Ess-neofab · A line- and system-level record of ESS and secondary-battery manufacturing processes
  • About
  • Contact
  • Privacy Policy
  • Disclaimer
Ashe Theme by WP Royal.