본문으로 바로가기
Ess-neofab

A line- and system-level record of ESS and secondary-battery manufacturing processes

  • 한국어
  • English
  • Home
  • Process
  • System
  • Interface
  • Traceability
  • News & Trends
  • About
  • Contact
  • 한국어
  • English
  • Home
  • Process
  • System
  • Interface
  • Traceability
  • News & Trends
  • About
  • Contact

카테고리

  • Interface (28)
  • News & Trends (20)
  • Process (32)
  • System (31)
  • Traceability (22)

최근 글

  • Five million ACC cells equal 2.7 to 3.6 months of nameplate outputOctober 15, 2026
  • A 160 MW battery’s six-week commissioning has two baselinesOctober 8, 2026
  • Two Cycles a Day Take 106.8 % of a Day, and the Retention Tier Shifts Cell Volume by 1.47 GWhOctober 1, 2026
  • Battwoo’s Second-Life EV Batteries — When an 80 % Acceptance Threshold Overlaps the Retirement Distribution, Incoming Screening Becomes the BottleneckSeptember 30, 2026
  • US storage set an energy record in Q2 as installed power fell 7%September 29, 2026
  • CATL Starts Trial Production in Debrecen — The Digits of the Defect-Rate Target, Not the Equipment, Set the Length of a Trial RunSeptember 29, 2026
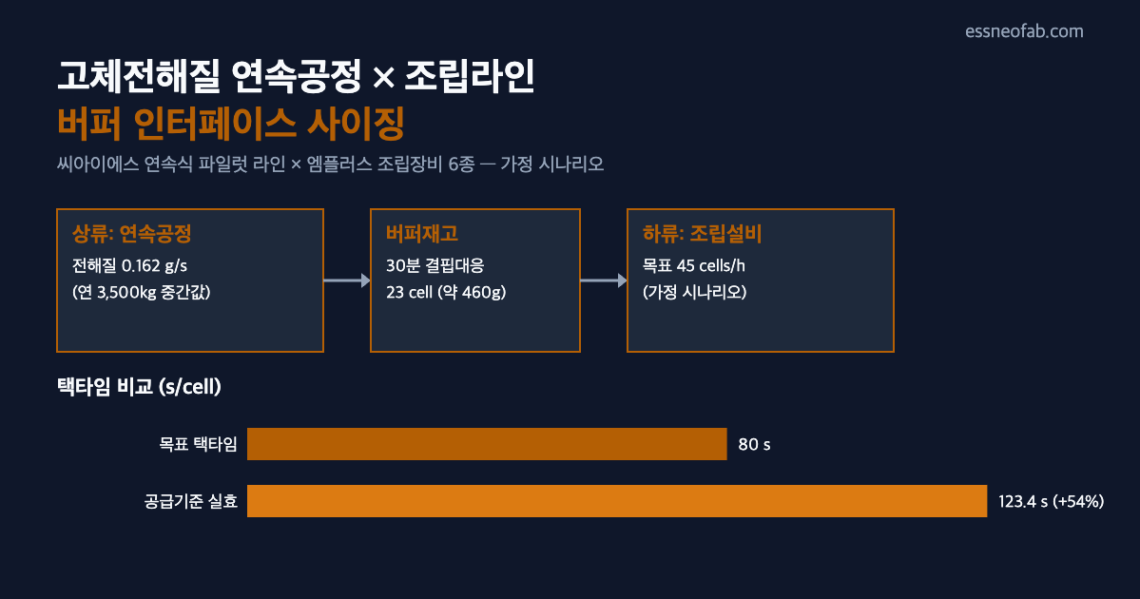
  • 고체전해질 연속공정과 조립라인 사이 버퍼재고 인터페이스 다이어그램
    Interface,  Process

    Between the Continuous Solid-Electrolyte Process and the Assembly Line: How Should the Buffer Interface Be Designed?

    August 31, 2026 /

    CIS's continuous-process pilot line for sulfide-based solid electrolyte at its Daegu Plant 3 (2–5 t/year, expanded from the existing batch process's 840 kg) and M Plus's order for six types of all-solid-state battery assembly equipment (targeting development/fabrication completion by end-2026) reveal a textbook interface problem: the production capacities of the upstream materials process and the downstream assembly process are not scaled up on the same timeline. This article estimates, as an assumed scenario, the buffer stock and takt-time loss required between these two processes, to quantitatively pin down why the materials-assembly interface design is a leading variable for the line's overall OEE (Overall Equipment Effectiveness). The downstream assembly equipment's target…

    read more
    ESS-neofab 1 Comment

    You May Also Like

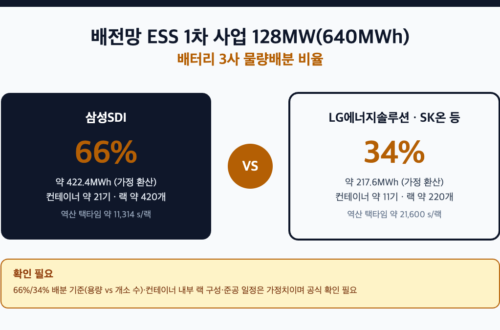
    배전망 ESS 1차 사업 128MW 물량이 삼성SDI 66%와 나머지 3사 34%로 배분되는 구조를 보여주는 비교 다이어그램

    128 MW of Distribution-Grid ESS Volume Allocated — Can the Battery Pack Assembly Line Absorb the Takt Time?
    September 4, 2026
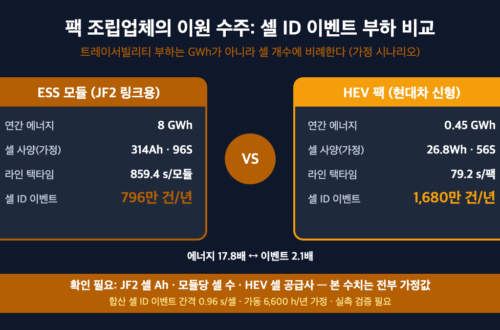
    팩 조립업체 이원 수주 셀 ID 트레이서빌리티 이벤트 부하 비교 — ESS 모듈 8GWh 796만 건 vs HEV 팩 0.45GWh 1,680만 건 (가정 시나리오)

    Sebang Lithium Battery’s Simultaneous HEV Pack and ESS Module Orders — Analyzing the Cell-Inbound Interface and Cell-ID Traceability Load
    September 8, 2026
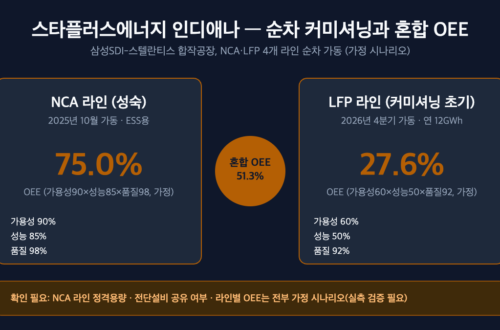
    삼성SDI 스타플러스에너지 인디애나 공장의 NCA·LFP 라인 순차 커미셔닝 일정과 혼합 OEE 개념도

    StarPlus Energy’s Indiana Plant — The Blended-OEE Illusion Created by Sequential NCA/LFP Commissioning
    September 9, 2026
© 2026 Ess-neofab · A line- and system-level record of ESS and secondary-battery manufacturing processes
  • About
  • Contact
  • Privacy Policy
  • Disclaimer
Ashe Theme by WP Royal.