Cell-ID Laser DPM Read Rate 99.5% vs 99.95%: How No-Reads Drive Exceptions per Shift and OEE
Abstract
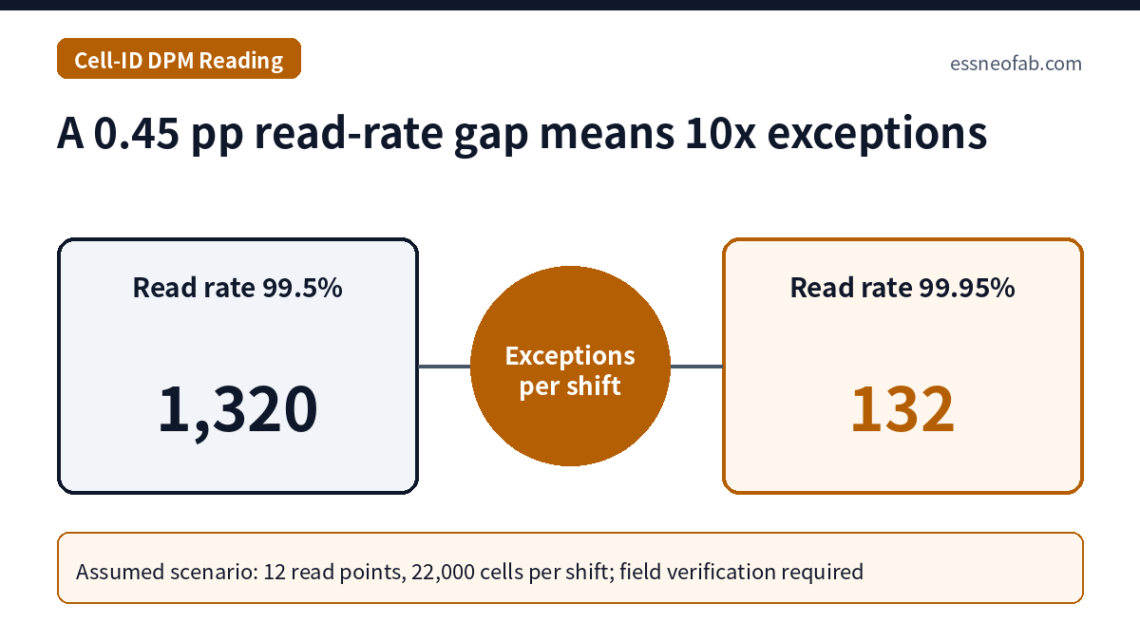
The read rate of a cell-ID direct part mark (DPM) is a probability defined at a single read point, but the line experiences it raised to the power of the number of read points each cell passes. Assuming 12 read points and 22,000 cells per shift, a 99.5% read rate generates 1,320 No-Read exceptions per shift, while 99.95% generates 132. Under the same assumptions, OEE falls from a baseline of 84.64% to 75.50% at 99.5% (−9.14 pp), but only to 84.13% at 99.95% (−0.51 pp). A DPM specification should therefore be defined not as “read rate X%” but by three items: verification grade immediately after marking (ISO/IEC 29158), allowable exceptions per shift, and exception-handling labor utilization.
1. Conclusion First — 99.5% Is 94% at the Cell Level
A DPM with a 99.5% read rate generates exceptions for roughly 6 of every 100 cells on a line with 12 read points, and the moment the labor demand for handling those exceptions exceeds the available shift time, performance loss turns into availability loss. Raising the read rate to 99.95% drops exception-handling labor utilization on the same line from 105.0% to 10.5%.
Situation (S): Cell IDs are assigned by laser-engraving a 2D DataMatrix[1] directly onto the can or pouch surface (DPM[2]), after which fixed readers at each process read it and bind process data to the cell ID. Complication (C): Equipment specifications often state a single figure such as “read rate of 99.5% or higher,” and this figure looks sufficiently high. Question (Q): What does that figure translate to in line exceptions, OEE[3], and traceability[4] completeness? Answer (A): For N read points, the cell-level exception-free pass rate is rN: 94.16% at 99.5% with 12 points, and 99.40% at 99.95% with 12 points.
The assumption this article refutes is that “a 0.45 pp difference in read rate is marginal.” That 0.45 pp is a tenfold difference in exception count, and depending on the exception-handling structure, it decides whether labor capacity is exceeded.
2. Mechanism — Verification Grade and Read Rate Are Metrics on Different Layers
Standards addressing DPM quality fall into three layers. ISO/IEC 16022 governs symbol structure, ISO/IEC 15415 print quality grading, and ISO/IEC 29158 quality assessment specific to direct part marking. The distinction that matters from a line perspective is that verification grade is the quality of the mark itself, measured once immediately after marking, while read rate is the proportion that downstream readers actually decode under real conditions.
| Document | Current edition (checked 2026-09-23) | Scope of measurement/specification | Role on the line |
|---|---|---|---|
| ISO/IEC 16022 | 2024 edition (3rd edition, replaces 2006) | DataMatrix symbol structure, encoding, error correction, reference decode algorithm | Basis for code size and data capacity design |
| ISO/IEC 15415 | 2024 edition (3rd edition, replaces 2011) | 2D symbol print quality. Overall grade is the lowest parameter grade. Numeric grades 4.0–0 (corresponding to A–F) | Verification of labels and printed codes. The standard’s own summary notes better DPM correlation when used with 29158 |
| ISO/IEC 29158 | 2025 edition (2nd edition). Replaces the 2020 edition and TR 29158:2011 (based on AIM DPM-1-2006) | DPM-specific illumination conditions (90°, D, 30Q, 30T, 30S) and modified parameters such as Cell Contrast, Cell Modulation, and minimum reflectance | Inline verification criterion right after the marking station. Grade reported as a DPM grade with the illumination angle specifier |
The point to read from Table 1 is that a 29158 grade does not directly guarantee read rate. Even with a good grade right after marking, downstream read rate falls when surface contamination, exterior treatment, handling marks, or reader-specific lighting and focus conditions change in later processes. The required grade immediately after marking should therefore be back-calculated from the read margin under the worst downstream condition, and this back-calculation requires field verification.
When a No-Read occurs, the line has three handling paths. First, automatic in-station re-read (lighting switch and re-capture). Second, stop and resolve with an operator’s handheld reader (stop-and-resolve). Third, divert to a reject buffer[5] for offline manual reading and re-induction (divert). The first and second create performance loss; the third creates labor load and traceability gaps.
3. Assumed Scenario Calculation — Exceptions, Labor Utilization, OEE
The calculation premises are as follows (all assumed). Available operating time per shift is 26,400 s (shift 28,800 s − planned stops 2,400 s), customer demand per shift is 22,000 cells, so takt time[6] is 26,400 s ÷ 22,000 = 1.2 s. Each cell passes 12 read points: 4 stop-and-resolve points synchronously coupled to the bottleneck, and 8 divert points decoupled by buffers.
At the 4 stop-and-resolve points, each No-Read takes an automatic re-read of 0.6 s, and 20% of those also fail and stop for 15 s for operator resolution. At the 8 divert points, each divert takes 30 s of operator time for offline manual reading and re-induction. There is one exception-handling operator, and 2% of all No-Reads cannot have their ID recovered even manually and are quarantined. Read failures are assumed independent across points.
| Item | Read rate 99.5% | Read rate 99.9% | Read rate 99.95% |
|---|---|---|---|
| Cell-level exception-free pass rate (r12) | 94.16% | 98.81% | 99.40% |
| No-Read exceptions per shift (sum of 12 points) | 1,320 | 264 | 132 |
| Stop-and-resolve lost time (4 points) | 1,584 s | 316.8 s | 158.4 s |
| Performance loss (vs. available operating time) | 6.00% | 1.20% | 0.60% |
| Unproduced cells at takt | 1,320 cells | 264 cells | 132 cells |
| Exception-handling labor demand | 27,720 s | 5,544 s | 2,772 s |
| Operator utilization (1 person, 26,400 s basis) | 105.0% | 21.0% | 10.5% |
| Availability loss (lower-bound approximation of excess work) | 5.00% | 0% | 0% |
| Cells with unrecoverable ID (per shift) | 26.4 cells | 5.28 cells | 2.64 cells |
| Traceability completeness | 99.880% | 99.976% | 99.988% |
| OEE (baseline 84.64%) | 75.50% | 83.61% | 84.13% |
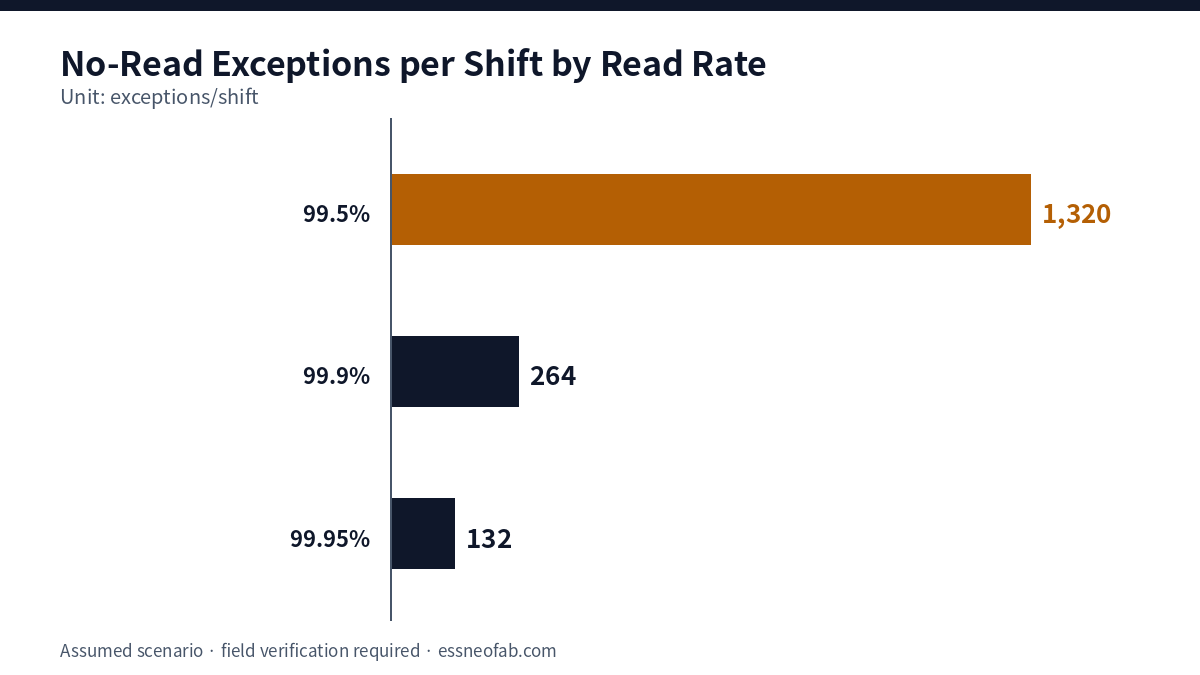
The key point of Table 2 is that the 8.63 pp OEE gap between 99.5% and 99.95% is not explained by performance loss (6.00%) alone; an availability loss of almost the same size (5.00%) is added by operator utilization exceeding 100%. Once utilization exceeds 100%, reject buffers cannot be emptied, and the moment a buffer fills, a divert point effectively becomes a stop-and-resolve point. The 5.00% availability loss in Table 2 is a lower-bound approximation converting excess work 1:1 into stoppage; given queueing behavior, actual loss grows larger as utilization approaches 100%.
Takt time is set by demand, so No-Reads do not change takt time itself. What changes is the margin to hold the 1.2 s takt, and at 99.5% the production opportunity equivalent to 1,320 cells per shift is lost to read-exception handling. This figure must be managed separately from cycle time or FPY.
4. Limits and Differentiation — The Direction in Which the Independence Assumption Breaks
Table 2 rests on the assumption that read failures are independent across points. In practice, a correlated structure appears in which cells with defective marks fail repeatedly at several points; in that case the number of exception cells falls, but the same cells repeatedly occupy buffers, so labor load does not fall much. The correlation differs by line and must be checked by joining per-point No-Read logs on cell ID.
Reader read rate is also not a function of reader specifications alone. Illumination angle, working distance, trigger timing, and cell posture variation are all variables, and read rates from equipment-level acceptance tests (FAT) cannot be applied 1:1 to a mass-production line. The gap between read rates measured under controlled variables and mass-production read rates requires further verification.
This differs from the article on where cell traceability breaks at the line level, which dealt structurally with where binding breaks. This article instead calculates how the failure probability of a single read, the input to binding, is amplified into line-wide exception load. The view that cell-ID event rate is proportional to cell count was covered in the article on cell inbound interfaces and cell-ID event rate; the exception count here connects to it as that event rate multiplied by (1 − r).
5. Conclusions and Implications
Defining a DPM specification by a single read-rate figure hides the exception load the line actually bears. Multiplying by the number of read points N, cells per shift, and time per exception-handling path translates read rate into exceptions per shift and labor utilization, and that translation simultaneously determines the performance and availability factors of OEE.
Under these assumptions, the lower bound of read rate at which labor utilization does not exceed 100% lies between 99.5% and 99.9%. The proposed target specification is therefore a read rate of at least 99.95% at every downstream point, an agreed ISO/IEC 29158 grade criterion right after marking, and exception-handling operator utilization of 50% or less. These targets are arbitrarily set values based on this assumed scenario and require field verification for each line.
FAQ
Q. DataMatrix has error correction and reads even when the mark is partly damaged, so isn’t concern about read rate exaggerated?
A. Error correction can restore partially damaged marks, but it cannot recover failures where the image itself is not obtained, such as illumination glare, defocus, or missed triggers. Moreover, if error-correction margin is already consumed at marking (a lower unused-error-correction grade in verification), the margin against downstream contamination disappears. Error correction therefore raises the lower bound of read rate but does not replace the exception-count calculation.
Q. Wouldn’t it be faster than 30 s if the operator keyed in the ID instead of reading it manually?
A. Time may be shortened, but transcription error is added as a new failure mode. A mistyped ID binds to another cell’s history, creating mis-binding that is harder to detect than a gap. From a traceability-completeness standpoint, it is more reasonable to restrict the manual path to handheld-reader reads and put keyed entry under a separate approval procedure.
Field Application Notes
Items executable first thing Monday morning.
| Check | How to execute | Notes |
|---|---|---|
| ☐ Inventory all read points | List every reader that reads the cell ID in process order, fix N, and classify each point as stop-and-resolve or divert | rN can only be computed once N is fixed |
| ☐ Extract per-point No-Read logs | From reader logs of the last 10 shifts, count read attempts and No-Reads per point | Record sample period and temperature/humidity conditions |
| ☐ Measure exception-handling time | Measure the time (s) of each path—automatic re-read, stop resolution, offline manual read—over at least 20 events | Record the 90th percentile along with the mean |
| ☐ Calculate operator utilization | Utilization = exceptions × time per path ÷ available operating time | If above 50%, review buffer saturation risk |
| ☐ Agree on post-marking verification grade | Agree in writing with the marking supplier on ISO/IEC 29158 illumination conditions and required grade | Back-calculate from read margin under the worst downstream condition |
Footnotes
[1] DataMatrix: A 2D matrix symbology representing data as an array of square or rectangular modules, specified by ISO/IEC 16022.
[2] Direct Part Marking (DPM): Engraving an identification code directly onto a part surface by laser, dot peen, etc., without a label.
[3] OEE (Overall Equipment Effectiveness): Availability × Performance × Quality.
[4] Traceability: A system that binds process, material, and inspection history to individual product IDs to enable backward and forward tracing.
[5] Reject Buffer: A space temporarily holding exception products diverted from the main flow. Its capacity and emptying interval are coupled with labor load.
[6] Takt Time: Available operating time ÷ customer demand. Not to be confused with cycle time or FPY.
Sources: ISO, “ISO/IEC 29158:2025 — Bar code symbol quality test specification — Direct part mark (DPM)”, 2025, https://www.iso.org/standard/87123.html / ISO, “ISO/IEC 29158:2020 — Direct Part Mark (DPM) Quality Guideline” (withdrawn), https://www.iso.org/standard/69411.html / ISO, “ISO/IEC TR 29158:2011”, https://www.iso.org/standard/45237.html / ISO/IEC TR 29158:2011 sample PDF (illumination conditions and parameters), iTeh Standards, https://cdn.standards.iteh.ai/samples/45237/e2de6c466ac741928e2b089ab9ad44ee/ISO-IEC-TR-29158-2011.pdf / ISO, “ISO/IEC 15415:2024 — Two-dimensional symbols”, 2024, https://www.iso.org/standard/76876.html / ISO, “ISO/IEC 16022:2024 — Data Matrix bar code symbology specification”, 2024, https://www.iso.org/standard/80926.html / Axicon, “ISO/IEC standard for 2D barcodes” (grading scheme), https://axicon.com/iso-2d
Measurement & Calculation Conditions: Shift 28,800 s, planned stops 2,400 s, available operating time 26,400 s, 22,000 cells per shift, 12 read points (4 stop-and-resolve, 8 divert), automatic re-read 0.6 s, re-read failure rate 20%, stop resolution 15 s, offline manual read 30 s, one exception-handling operator, unrecoverable-ID rate 2%, independence of read failures across points, and the baseline OEE composition (availability 90%, performance 95%, quality 99%) are all assumed values. Performance loss is approximated as a simple ratio to available operating time, and temperature, humidity, and sample-size conditions must be recorded separately in field measurement. Field verification is required.