Traceability Events at the ISA-95 L2→L3 Boundary: How OPC UA Polling, Subscriptions and MES Handshakes Erode Takt Time
Abstract
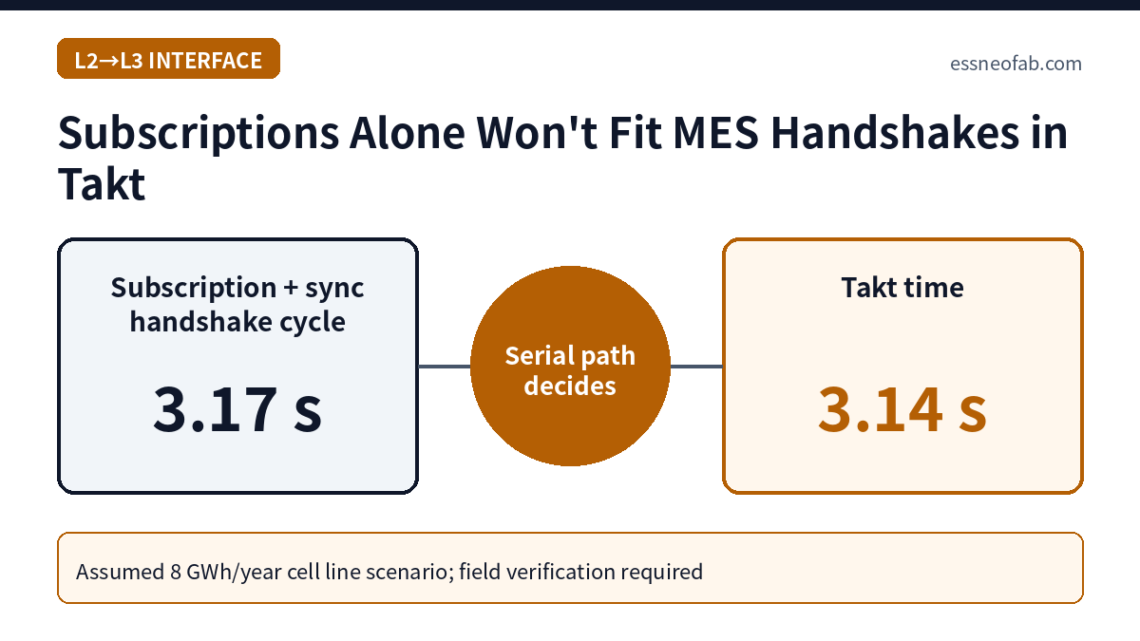
At the boundary between equipment (ISA-95 Level 2) and MES (Level 3), the main reason traceability events erode takt time is not the transport method (polling vs. subscription) but a structure in which the MES acknowledgement (handshake) sits serially on the critical path of the station cycle. On an 8 GWh/year cell line (assumed takt time 3.14 s, net station processing 2.80 s), 1.0 s polling with a synchronous handshake adds an average of 0.72 s, stretching the cycle to 3.52 s and creating a shortfall of about 10.9% against required quantity; switching to a 0.1 s/0.2 s subscription still adds 0.37 s on average and still exceeds takt time.
Only a store-and-forward structure, which detaches the handshake from the critical path and releases the part right after a local buffer write, fits within the 0.34 s margin at about 0.02 s. Event loss likewise arises from structure rather than event rate—specifically, designs in which a multi-nest station shares a single variable subscribed with a queue size of 1.
1. Conclusion First — What Is Slow Is Not the Communication but the Waiting
The traceability latency problem at the L2→L3 boundary is determined not by “how fast data is sent” but by “whether the equipment waits for the MES response.” Replacing polling with subscriptions roughly halves average latency, but as long as the acknowledgement is tied to the part-release condition, the remaining latency is added directly to the cycle.
Situation (S): On cell and module lines, the interface that records process results and part serials in the MES[1] sits on the boundary between Level 2 (control) and Level 3 (manufacturing operations management) of ISA-95 (IEC 62264)[2], and OPC UA (IEC 62541)[3] is now the de facto transport layer. Complication (C): Many lines prevent recording gaps with a synchronous handshake[4]—”no part leaves until the MES write is complete”—which transplants the entire L3 latency distribution into the L2 cycle. Question (Q): Which of polling and subscription delivers events without loss within takt time? Answer (A): Neither is sufficient on its own; the handshake must be removed from the critical path and responsibility for loss prevention moved to buffers on both sides of the boundary.
The assumption this article challenges is that “switching to subscriptions solves both latency and loss.” Subscription only lowers mean latency, and loss can in fact originate in the subscription settings (queue size).
2. Mechanism — The Four Segments an Event Crosses at the L2→L3 Boundary
The latency from the moment a station finalizes a part result until the PLC receives the acknowledgement and permits release is expressed as the sum of four segments.
ths = tdetect + tmes + tack + tscan
tdetect is the time until the MES (or L3 connector) recognizes a new result, tmes is validation and DB commit time, tack is acknowledgement write time, and tscan is the scan delay until the PLC reads the response bit. The transport method affects only tdetect; the other three segments remain identical for polling and subscription.
OPC UA subscription[5] behavior is specified in IEC 62541-4 (OPC 10000-4). A subscription bundles pending notifications every publishing interval, sends a keep-alive after a set number of empty cycles, and is closed—its MonitoredItems deleted—when no client Publish request is available for the lifetime count of consecutive cycles. Also, when a new notification arrives while the MonitoredItem queue is full, the server either discards the oldest notification or overwrites the last value, and with a queue size of 1 the queue becomes “a buffer that always holds only the newest value.”
| Delivery method | Variable determining tdetect | Where loss occurs | Handshake coupling |
|---|---|---|---|
| Polling (repeated Read) | Polling interval Tp (mean Tp/2, worst Tp) | Intermediate values unobserved when two or more events occur within one interval | Usually synchronous |
| Subscription (Client/Server, IEC 62541-4) | Sampling interval + publishing interval | Discard/overwrite on queue overflow; subscription closed on lifetime expiry | Synchronous or asynchronous |
| PubSub (IEC 62541-14) | Publishing interval + broker/network latency | Gaps hard to detect in configurations whose transport does not guarantee receipt | Separate response channel required |
| Store-and-forward[6] (L2 local buffer) | Only local write time remains on the critical path | Determined by overflow policy (stop or overwrite) when the buffer saturates | Asynchronous (send after release) |
The column to watch in Table 1 is “handshake coupling.” The transport method changes only the size of tdetect, whereas the coupling method decides whether the entire latency enters the cycle, so the two must be evaluated as separately controlled variables.
3. Calculation — Does the Handshake Fit Within Takt Time in an Assumed Scenario?
The line conditions are assumed as follows. With a capacity of 8 GWh/year and 314 Ah, 3.2 V cells (about 1.0048 kWh per cell), customer-required quantity is about 7,961,783 cells/year. Taking available operating time as 340 days × 86,400 s × 0.85 = 24,969,600 s, takt time[7] is 24,969,600 s ÷ 7,961,783 cells = about 3.14 s/cell.
Assuming 12 stations record traceability results, the line-wide event rate is about 3.83 events/s, or about 0.32 events/s per station. The target station’s net processing cycle time[8] is assumed at 2.80 s, giving a margin of 0.34 s against takt time. MES validation and DB commit are assumed at 0.15 s on average with a top-1% tail (p99) of 0.60 s, acknowledgement write 0.05 s, and PLC scan 0.02 s.
| Scenario | Mean tdetect | Mean handshake latency | p99 latency | Effective cycle (mean) | vs. takt time | Shortfall vs. required quantity |
|---|---|---|---|---|---|---|
| A. 1.0 s polling + synchronous handshake | 0.50 s | 0.72 s | 1.67 s | 3.52 s | 112.2% | about 10.9% |
| B. Subscription (sampling 0.1 s, publishing 0.2 s) + synchronous handshake | 0.15 s | 0.37 s | 0.97 s | 3.17 s | 101.1% | about 1.1% |
| C. Store-and-forward (asynchronous) | Off critical path | 0.02 s | 0.02 s (local write) | 2.82 s | 89.9% | 0% |
| Baseline: takt margin | — | 0.34 s | — | 2.80 s (net processing) | 89.3% | — |
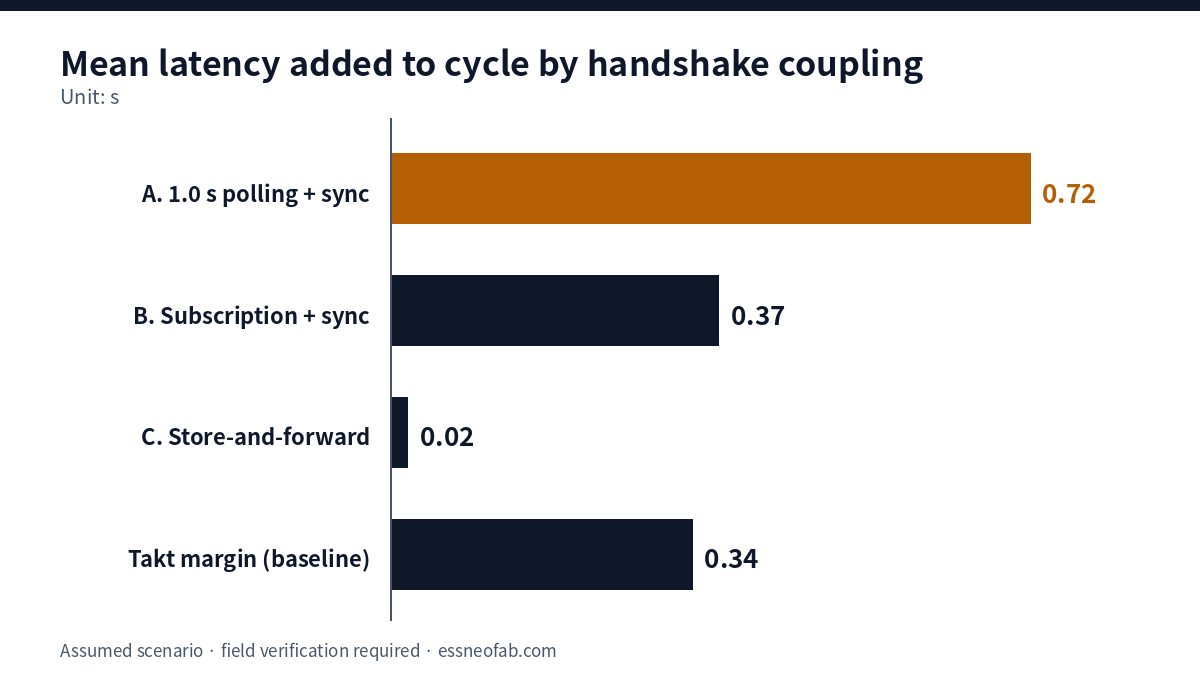
The baseline in Table 2 is the 0.34 s takt margin. Scenario A exceeds twice the margin on the mean alone, and B, despite halving the mean latency to 0.37 s, still exceeds the margin by 0.03 s and cannot meet required quantity. The implication is clear: switching to subscription is a meaningful improvement, but it is not a sufficient condition for takt compliance while the serial structure remains.
The p99 column provides a stricter criterion than the mean. B’s p99 effective cycle is 2.80 + 0.97 = 3.77 s, so one in every 100 parts exceeds takt time by 0.63 s. This tail comes from events inside L3—MES DB checkpoints, backups, index rebuilds—and the essential risk of synchronous coupling is that variables the L2 equipment engineer cannot control are transferred directly into the L2 cycle.
4. Loss Comes from Structure, Not Event Rate
When results occur regularly at 3.14 s takt intervals, two events rarely overlap within one 0.2 s publishing interval in steady state. Loss concentrates at moments when regularity breaks. A typical case is a station whose 4 nests finish simultaneously and write results sequentially into a single “latest serial” variable. If that variable is subscribed with a queue size of 1, only the newest value remains as IEC 62541-4 specifies, so the preceding 3 records written within the same sampling interval are theoretically all lost (75% of 4).
The same structural loss appears on restart after a stoppage. When parts accumulated in a buffer are released at short intervals, the instantaneous event rate jumps to several times normal, and if the queue cannot hold this burst, overwriting occurs. Queue size must therefore be sized by the number of nests and the restart burst length rather than the mean event rate, and each result record should carry a monotonically increasing sequence number so that L3 can detect loss as gaps.
The constraint of store-and-forward is not storage capacity but the PLC-side ring buffer size and overflow policy. Assuming an MES outage of 1,800 s, line-wide accumulated events are about 6,887, only about 14.1 MB even at an assumed 2 KB per record. But if the station PLC ring buffer holds 256 records, it covers only about 803 s at 0.32 events/s per station, and unless the policy thereafter (line stop or overwrite) is documented in advance, loss occurs silently.
Standardization activity also touches this boundary directly. VDMA 40750 (OPC UA for Battery Production – Part 1: General) was published as a June 2026 draft (Release Candidate 1.0, comment deadline 2026-08-01); it strongly recommends applying OPC 40001-3 (OPC UA for Machinery – Job Management, 1.0.1, 2024-05-01) for production data required for traceability. The OPC UA mapping of ISA-95 job orders and job responses is covered by OPC 10031-4 (OPC UA for ISA-95 – Part 4: Job Control). However, whether these documents prescribe handshake timing or acknowledgement coupling could not be confirmed within their public scope (verification required), so the coupling structure remains the line designer’s responsibility.
This differs in kind from the impact of gateway aggregation for edge AI vision and leak inspection on traceability completeness. That article dealt with horizontal aggregation of inspection data into a gateway within L2, while this one addresses the vertical boundary between L2 and L3 and how acknowledgements crossing it are inserted into the cycle.
5. Conclusions and Implications
An L2→L3 traceability interface must be decomposed into two variables: transport method and coupling method. In the assumed scenario, improving transport (polling → subscription) reduced mean latency from 0.72 s to 0.37 s, but did not eliminate takt overrun while synchronous coupling remained. Only changing the coupling to asynchronous (store-and-forward) reduced critical-path latency to about 0.02 s.
In exchange, the quality interlock “no release before recording” must be relocated into two interlocks: “stop at buffer high level” and “confirm MES record on entry to the next process.” The basis of loss prevention thus shifts from the handshake to sequence numbers and buffer levels.
The structural conclusion (serial coupling transfers the L3 tail into the L2 cycle) holds regardless of the assumed values, but figures such as the 10.9% and 1.1% shortfalls require further verification by measurement on one’s own line.
FAQ
Q. If the synchronous handshake is removed, won’t parts not recorded in the MES pass to the next process and break the quality interlock?
A. This is a valid objection. That is why asynchrony must be a relocation of the interlock, not its removal. Combining a look-ahead query that confirms the serial’s L3 record on entry to the next station with a local buffer high-level stop blocks the path for unrecorded parts to leave the line while taking the acknowledgement off the critical path. Whether the look-ahead query completes within part transfer time, so that its own latency does not enter the next station’s cycle, requires field verification.
Field Application Notes
Items that can be executed first thing Monday morning.
| Check | How to execute | Remarks |
|---|---|---|
| ☐ Identify handshake coupling | For each traceability station, check in PLC logic whether it “releases after waiting for MES response” and list them | Synchronously coupled stations are the targets of the Table 2 calculation |
| ☐ Measure the four ths segments | Compare PLC result-finalization and response-receipt timestamps against MES receipt and commit logs for one week; compute mean and p99 | Check clock synchronization error first |
| ☐ Check subscription queue size | Compare the MonitoredItem queue size of result variables with the station’s number of nests | Queue size 1 + multiple nests = structural loss candidate |
| ☐ Query sequence-number gaps | Confirm result records carry monotonically increasing numbers; if so, count gaps over the last 30 days in the MES | If no numbers exist, introducing them is the top priority |
| ☐ Document local buffer overflow policy | Compute coverage time as PLC ring buffer size ÷ station event rate and formalize the stop/overwrite policy at saturation | About 803 s under this article’s assumptions |
Footnotes
[1] MES (Manufacturing Execution System): A system at ISA-95 Level 3 that manages work orders, production results, quality and genealogy records.
[2] ISA-95 (IEC 62264, Enterprise-Control System Integration): A standard defining the integration model between enterprise (Level 4) and control (Levels 0–2). Level 2 corresponds to monitoring and control by PLCs, DCSs and similar; Level 3 to manufacturing operations management.
[3] OPC UA (OPC Unified Architecture, IEC 62541): An industrial communication standard including information models and services (read, write, subscribe, method call).
[4] Handshake: A procedure in which the sender signals that data is ready and proceeds to the next action only after receiving the receiver’s acknowledgement.
[5] Subscription / MonitoredItem: The OPC UA mechanism by which a server notifies changes in monitored targets (MonitoredItems) every publishing interval.
[6] Store-and-forward: A method that first stores data locally and transmits it later regardless of connection state.
[7] Takt Time: Available operating time ÷ customer-required quantity. Not to be confused with cycle time or FPY.
[8] Cycle Time: The time a station actually takes to process one part.
Sources: ISA-95 Standard (ISA), https://www.isa.org/standards-and-publications/isa-standards/isa-95-standard · OPC 10000-4 Subscription model, https://reference.opcfoundation.org/Core/Part4/v105/docs/5.14.1 · OPC 10000-4 MonitoredItem queue, https://reference.opcfoundation.org/Core/Part4/v104/docs/5.13.1 · IEC 62541-14:2020 PubSub, https://webstore.iec.ch/en/publication/61108 · VDMA 40750:2026-06 Draft, https://www.vdma.eu/documents/d/group-34568/draft_vdma_40750_2026-06 · OPC 40001-3 Job Management 1.0.1 (2024-05-01), https://reference.opcfoundation.org/Machinery/Jobs/v100/docs/ · OPC 10031-4 Job Control Scope, https://reference.opcfoundation.org/specs/OPC-10031-4/1
Measurement & Calculation Conditions: Capacity 8 GWh/year, 314 Ah and 3.2 V cells, available operating time 24,969,600 s/year (340 days × 86,400 s × 0.85), 12 traceability stations, net processing cycle time 2.80 s, polling interval 1.0 s, subscription sampling 0.1 s and publishing 0.2 s, MES processing mean 0.15 s and p99 0.60 s, acknowledgement write 0.05 s, PLC scan 0.02 s, local ring buffer 256 records, 2 KB per record and a 1,800 s MES outage are all assumed values. Results vary with network load, MES DB state and PLC scan settings, so field verification is required, and testbed measurements are not applied 1:1 to production lines.


You May Also Like
The 2026 Edition of NFPA 855 Changes ESS Rack Design and Traceability Documentation at the Same Time
EU Battery Passport 2027: Which Station on an ESS Pack Line Commits What