“Capturing the U.S. ESS Market” — K-Battery Supply Chain’s Wave of Localization: What’s Going Where
Abstract
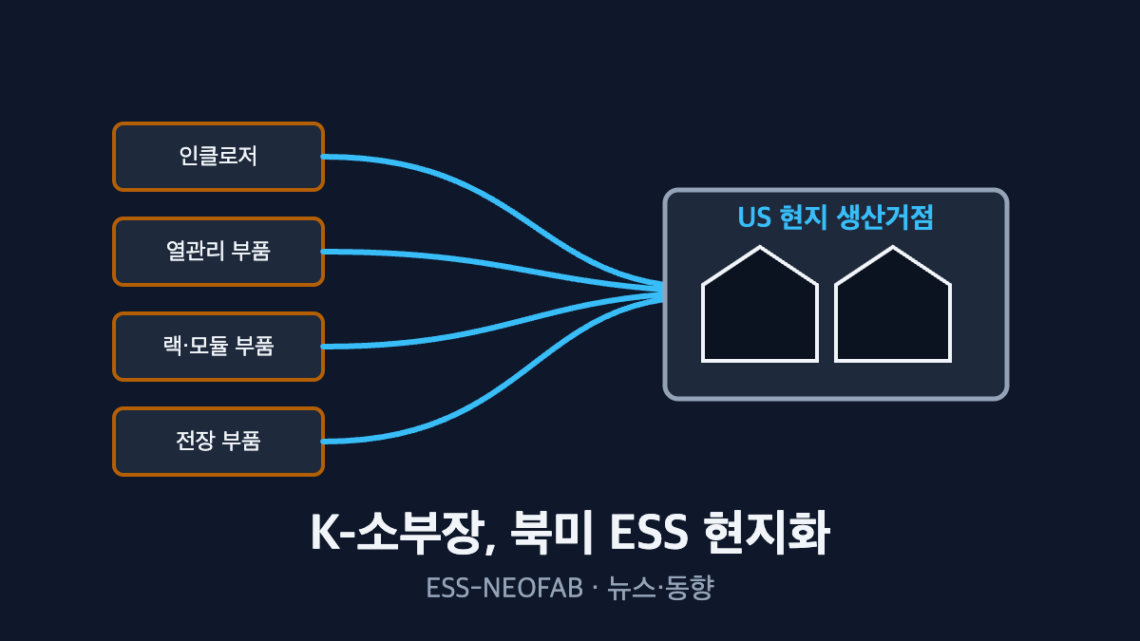
Four Korean ESS materials, parts, and equipment companies are simultaneously establishing production sites in the United States. Seojin System began final assembly of battery enclosures for Samsung SDI America in Indiana in July 2026; Shinsung ST is preparing liquid-cooled thermal management parts in Kentucky, Hanjoong NCS liquid-cooled cooling systems in Indiana, and Sebang Global Battery an ESS business base through its U.S. subsidiary. This article reads this trend not as “component-by-component localization” but through a system variable: “the number of supply interfaces connected in series to the local assembly line.” In an assumed scenario, even if each supplier’s on-time supply probability is 95 %, increasing the number of serial suppliers from 1 to 4 lowers the probability that assembly proceeds without a stockout from 95.0 % to 81.5 %.
1. The Conclusion First — As Localized Suppliers Increase, the Stockout Risk of the Assembly Line Grows Multiplicatively
The key line-level variable of ESS supply chain localization is not the shortening of component transport distance, but the number of supply interfaces tied in series to the final assembly line and the differences in ramp-up timing across those interfaces.
Situation (S): North American ESS shipments by Korean battery makers in the first half of 2026 reached 76 GWh, up 83 % year on year (press report citing SNE Research). Complication (C): To meet this demand, materials, parts, and equipment companies responsible for enclosures, thermal management parts, cooling systems, and batteries are setting up sites in different states. Question (Q): What does the simultaneous localization of four companies with non-overlapping component coverage demand of the assembly line? Answer (A): Non-overlapping coverage means there is no alternative supply source, which creates a serial structure in which a supply delay at any one company leads directly to a line stoppage.
2. Facts — What the Four Companies Are Placing and Where
| Company | Site | Item | Disclosure status |
|---|---|---|---|
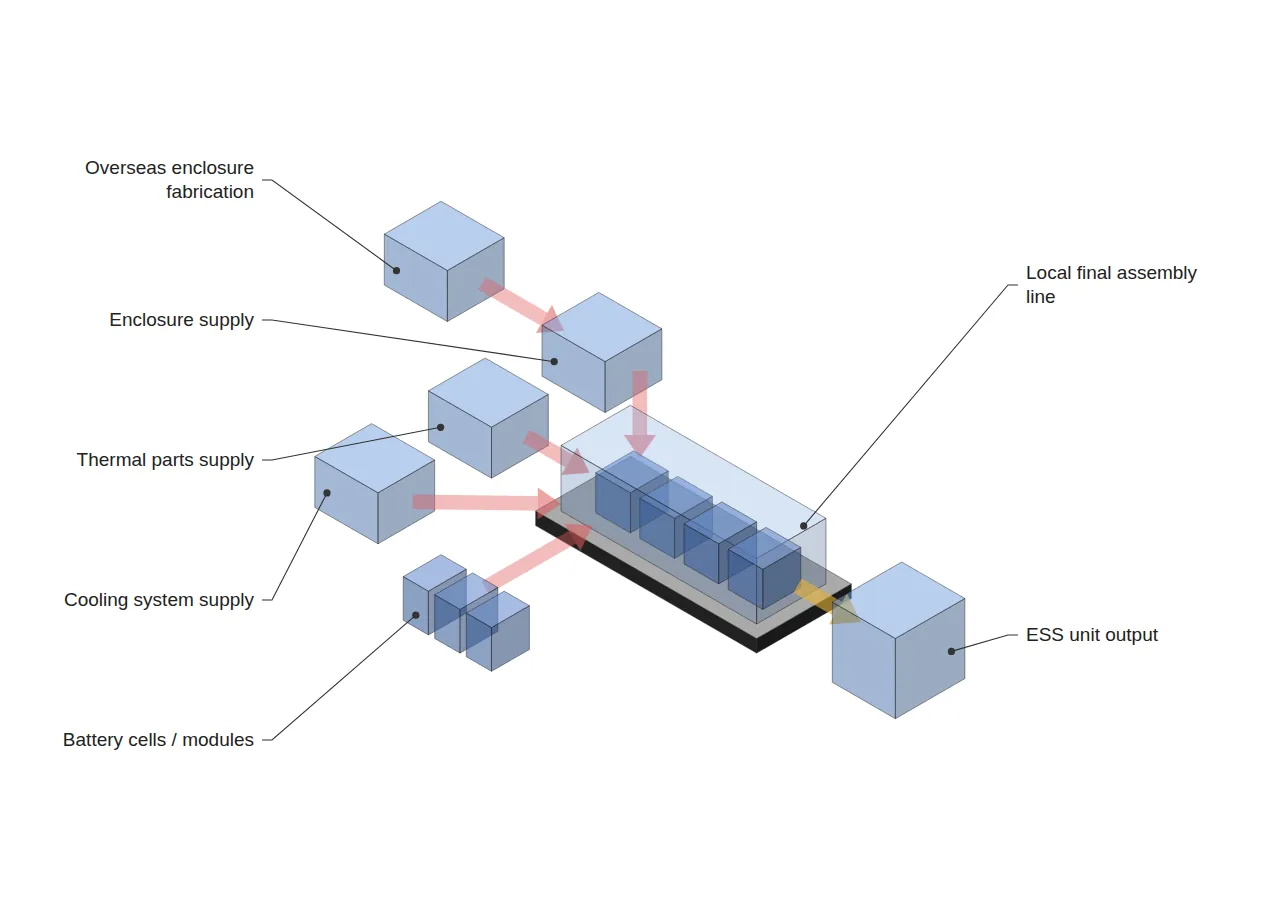
| Seojin System | Indiana, USA | Battery enclosures for ESS (contract processing) | Full operation from 2026-07. A five-year contract under which enclosures are fabricated in Vietnam and shipped to Indiana, where final assembly with batteries supplied by Samsung SDI is performed before delivery to Samsung SDI |
| Shinsung ST | Kentucky, USA | Liquid-cooled thermal management parts for ESS | Capital of the Kentucky subsidiary increased to USD 20 million (reported 2025-12), mass production planned for 2026. Customer reported as LG Energy Solution (verification required) |
| Hanjoong NCS | Huntington, Indiana, USA | Liquid-cooled cooling systems for ESS | Groundbreaking 2026-04-14, for Samsung SDI’s LFP-based SBB 2.0, mass production targeted for the first half of 2027 |
| Sebang Global Battery | USA (subsidiary Sebang Lithium Battery America) | ESS batteries | KRW 100 billion investment, payment planned for 2026-07-01. Production capacity and customers not disclosed |
The fact confirmed by the table is that the start-up timings differ. Seojin System is already operating, Shinsung ST targets 2026, and Hanjoong NCS targets the first half of 2027. Therefore, the point at which the local assembly line operates on a fully local sourcing configuration is bound to the ramp-up of the latest supplier.
3. Mechanism — Serial Supply Interfaces and Assembly Takt Time
One ESS unit is completed only when the enclosure, cooling system, thermal management parts, and cells/modules are all available. If each item has only one supplier, the supply interfaces[1] form a serial structure from the assembly line’s standpoint, and the probability that assembly proceeds without a stockout equals the product of each supplier’s on-time supply probability. The figures below are an assumed scenario for structural illustration.
| Number of serial suppliers | On-time supply probability per supplier (assumed) | Probability of assembly without stockout | Change from baseline |
|---|---|---|---|
| 1 | 95 % | 95.0 % | Baseline |
| 2 | 95 % | 90.3 % | −4.7 %p |
| 3 | 95 % | 85.7 % | −9.3 %p |
| 4 | 95 % | 81.5 % | −13.5 %p |
Even if each supplier’s reliability is identical, the stockout risk of the line as a whole grows meaningfully as more interfaces are tied in series. Because this loss occurs even when the assembly equipment is fully functional, it appears as “material-shortage stoppage” in the availability factor of OEE (Overall Equipment Effectiveness = Availability × Performance × Quality).
The speed baseline of the assembly line is set as well. Calculating takt time[2] (available operating time ÷ customer demand quantity) under assumed conditions (250 days/year × 16 h of operation = 14,400,000 s, 1,000 ESS units per year) gives 14,400 s/unit. Even if the assembly margin per unit is large, a single stockout consumes the entire takt time of that unit, so what must be managed on this line is the synchronization of supply interfaces rather than cycle time.
4. Limits of Application — The Seojin System Model Leaves an Ocean Leg
Seojin System’s structure is fabrication in Vietnam → final assembly in Indiana. In other words, even under “localization,” the Vietnam–U.S. transport leg remains as a supply interface. Even with a local site, if upstream processes are overseas, the inbound buffer in front of the assembly line does not disappear.
This differs in focus from 45 Days from Pohang to Georgia — Safety Stock at an Intercontinental Cathode Interface Is Driven by Lead-Time Variability, Not Demand, which dealt with how lead-time variability in intercontinental cathode supply inflates safety stock. Whereas that article addressed the lead-time variability of a single item, this article addresses the probability of simultaneous stockouts when suppliers of multiple items are connected in series. In addition, the 95 % on-time supply probability is an assumed value, and the actual delivery compliance rate of each supplier must be confirmed with contract and operating data (further verification required).
5. Conclusions and Implications
The simultaneous localization of the four K-battery materials, parts, and equipment companies is a move to fill gaps in the North American ESS supply chain. From the assembly line’s perspective, however, it is also a change in which supply interfaces multiply in series. When suppliers with different ramp-up timings are tied to one line, the operating plan should be set on the basis of the latest supplier, and inbound buffers should be allocated first to items with no alternative supply source.
FAQ
Q. Doesn’t localization shorten lead times and thus actually lower stockout risk?
A. For a single item, yes. However, when multiple suppliers with non-overlapping coverage are connected in series, the probability of assembly without stockout decreases multiplicatively even if each supplier is highly reliable (assumed scenario: 81.5 % with 4 in series). Lead-time reduction and the increase in the number of interfaces must be managed as separate variables.
Q. Where does Sebang Global Battery’s U.S. site fit in this structure?
A. The disclosed information extends only to the KRW 100 billion investment and the plan for an ESS business base; production capacity and customers have not been disclosed. Whether it will be connected to the same assembly line as the other three companies is an item for which verification is required.
Field Application Notes
| Check | How to execute | Remarks |
|---|---|---|
| ☐ List serial supply interfaces | Extract only single-supplier items from the ESS unit BOM and compile a serial list | Mark whether an alternative supply source exists |
| ☐ Measure on-time supply rate by supplier | From recent receiving history, aggregate the ratio of arrivals against promised delivery dates by supplier | Estimate line stockout probability as the product |
| ☐ Align ramp-up timings | Arrange each supplier’s mass-production target date in one table and set the latest date as the line start-up baseline | e.g., items targeted for the first half of 2027 |
| ☐ Separate stockout stoppage codes | Record material-shortage stoppages under a stoppage code different from equipment failure | Distinguish causes of OEE availability loss |
Footnotes
[1] Supply Interface: the boundary at which materials pass from an external supplier to the assembly line. In this article, one supplier per item is counted as one interface.
[2] Takt Time: available operating time ÷ customer demand quantity. It is not to be confused with cycle time (Cycle Time), the time equipment takes to produce one unit, or with the first-pass yield FPY.
Sources: Seojin System signs North American ESS battery enclosure contract-processing agreement with Samsung SDI (Etoday, https://www.etoday.co.kr/news/view/2598230) / Shinsung ST increases capital of Kentucky subsidiary (EBN, 2025-12-03, https://www.ebn.co.kr/news/articleView.html?idxno=1689542) / Hanjoong NCS breaks ground on North American plant (The Elec, https://www.thelec.kr/news/articleView.html?idxno=55623) / Sebang Global Battery commits KRW 100 billion to U.S. ESS (The Elec, https://www.thelec.kr/news/articleView.html?idxno=57542) / K-battery North American ESS shipments up 83% (Etoday, 2026-08-14, https://www.etoday.co.kr/news/view/2614302) / “Capture the U.S. ESS market”: K-battery materials, parts, and equipment firms localize one after another (The Korea Times U.S. edition, 2026-08-06, http://www.koreatimes.com/article/20260806/1624639)
Measurement & Calculation Conditions: (The body text was supplemented on 2026-09-23.) The on-time supply probability of 95 % per supplier, operating conditions of 250 days/year × 16 h (14,400,000 s), and ESS unit demand of 1,000 units per year are all assumed values for structural illustration. Delays among suppliers were assumed to be mutually independent; in practice they may be correlated, for example through shared logistics routes. Field verification is required.
Related reading — Samsung SDI Turns Its GM Joint-Venture Plant Into an ESS Hub · 45 Days from Pohang to Georgia — Safety Stock at an Intercontinental Cathode Interface Is Driven by Lead-Time Variability, Not Demand


You May Also Like
Doubling the Renewable-Energy Budget and Underground-Parking EV Fire-Detection AI — Two Signals the 2027 Budget Sends to the ESS Line

From EV to ESS Use: What Ultium Cells and Cosmos Lab Show About Converting a Line’s Purpose
3 Comments
Pingback:
Pingback:
Pingback: