ESS Fire Investigation and Traceability: Decomposing Reverse-Trace Time from the Incident Rack to Same-Lot Sites
Abstract
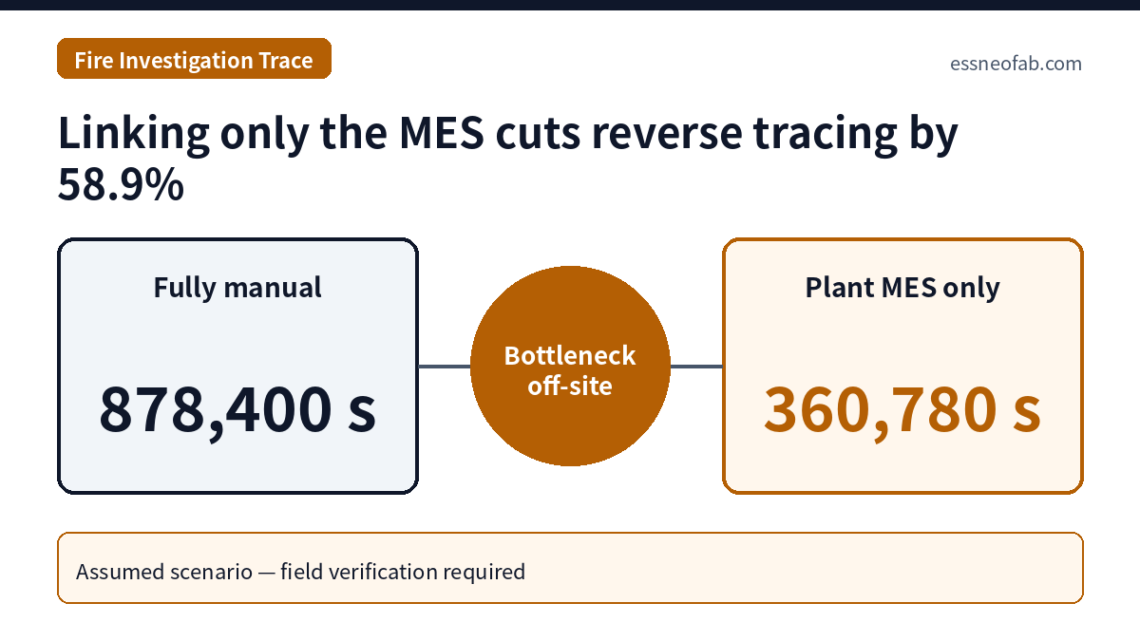
According to EPRI’s 2024 white paper, only 26 of the 81 incidents (32.1%) in its BESS Failure Incident Database had sufficient information to assign a root cause, and the loss of physical evidence after fire was cited as the reason manufacturing defects were the least-classified root cause. What remains once physical evidence has burned is the linked data stored outside the site, namely traceability. Decomposing a five-step reverse trace from one incident rack to cell lot, process parameters, and the installation positions of the same lot at other sites under an assumed scenario gives 878,400 s for a fully manual path and 1,710 s for a fully connected database. However, connecting only the in-plant MES still leaves 360,780 s, of which 99.8% arises in steps outside the factory (site as-built records and post-shipment installation positions).
1. Conclusion First — Reverse-Trace Time Is Governed by Join Keys Outside the Factory
In ESS fire investigations, the traceability[1] bottleneck is not the query speed of the plant MES[2] but the absence of a join key linking “which cell went into which rack at which site” after shipment. This article does not assert any cause. Cause determination belongs to the investigating body; what is addressed here is a system-design question: how quickly can the data required for that determination be assembled?
Situation (S): In Korea, 23 ESS fires occurred starting with Gochang, Jeollabuk-do on 2 August 2017, and on 11 June 2019 the joint public-private investigation committee announced four factors: inadequate battery protection systems, inadequate management of the operating environment, installation negligence, and inadequate integrated control and protection systems. Complication (C): On 6 February 2020, a second investigation team judged 4 of 5 fires to be battery anomalies, citing “analysis of similar batteries in nearby ESS” as one basis, and the manufacturers disputed this. Question (Q): How long does it take to locate identical or similar batteries at other sites for comparison, and what must be connected? Answer (A): If the broken link sits outside the factory, no amount of in-plant digitalization reduces reverse-trace time by more than 58.9%.
The assumption this article challenges is that “once MES genealogy[3] is in place, incident reverse tracing is solved.” The five-step decomposition below shows the structure under which that assumption fails.
2. Mechanism — Five Joins from the Incident Rack to Other Sites
A reverse trace is a chain of joins that sequentially links records scattered across different systems. Each join requires a key shared by the records on both sides, and if the key is missing anywhere, that step reverts to manual document reconciliation. Because module labels and rack BMS[4] local storage may be lost together at a fire site, it is conservative to treat only keys with an off-site copy as actually usable.
| Step | Join | Required linked data (join key) | Record holder | Loss risk in fire |
|---|---|---|---|---|
| ① | Incident rack ID → module serials | Rack position ↔ module serial mapping in site as-built records | EPC / SI | High if only on-site documents exist |
| ② | Module serial → cell IDs | Cell-to-module aggregation events on the module assembly line | Pack/module manufacturer | Low (plant server) |
| ③ | Cell ID → cell lot | Cell line genealogy (lot, equipment, production date) | Cell manufacturer | Low |
| ④ | Cell lot → process parameters | Lot-level process records (assembly conditions, formation/aging OCV and IR distributions, etc.) and control limits | Cell manufacturer | Low |
| ⑤ | Cell lot → installation positions of the same lot at other sites | Reverse aggregation (lot → all modules) + shipping records + as-built records of each site | Manufacturers, logistics, each site’s EPC | High risk of gaps due to distributed storage |
In Table 1, steps ② to ④ sit within the manufacturer’s internal systems and are resolved inside one organization. Steps ① and ⑤, by contrast, have records scattered across each site’s EPC, SI[5], and logistics providers, and step ⑤ in particular has a fan-out structure repeated once per site. This asymmetry produces the time gap in Section 3.
3. Assumed Scenario — Step-by-Step Time Comparison
One incident rack is assumed to be 8 modules × 52 cells = 416 cells (approximately 372.7 kWh assuming 280 Ah, 3.2 V). The cells in this rack are assumed to come from 3 lots, which were shipped to 12 sites in total. The 3 lots are assumed to be processed in parallel by separate staff, so time is calculated along the longest path.
The time model is as follows. On the manual path, step ⑤ is assumed to take 28,800 s per site for shipping-record reconciliation and as-built document checks; on the connected-database path, 75 s per site for query and review.
T = t1 + t2 + t3 + t4 + Nsite × t5
| Step | A. Fully manual (s) | B. Plant MES only connected (s) | C. Fully connected DB (s) |
|---|---|---|---|
| ① Rack → module | 14,400 | 14,400 (manual) | 30 |
| ② Module → cell | 86,400 | 60 | 60 |
| ③ Cell → lot | 172,800 | 120 | 120 |
| ④ Lot → process parameters | 259,200 | 600 | 600 |
| ⑤ Lot → other sites (12) | 345,600 | 345,600 (manual) | 900 |
| Total | 878,400 | 360,780 | 1,710 |
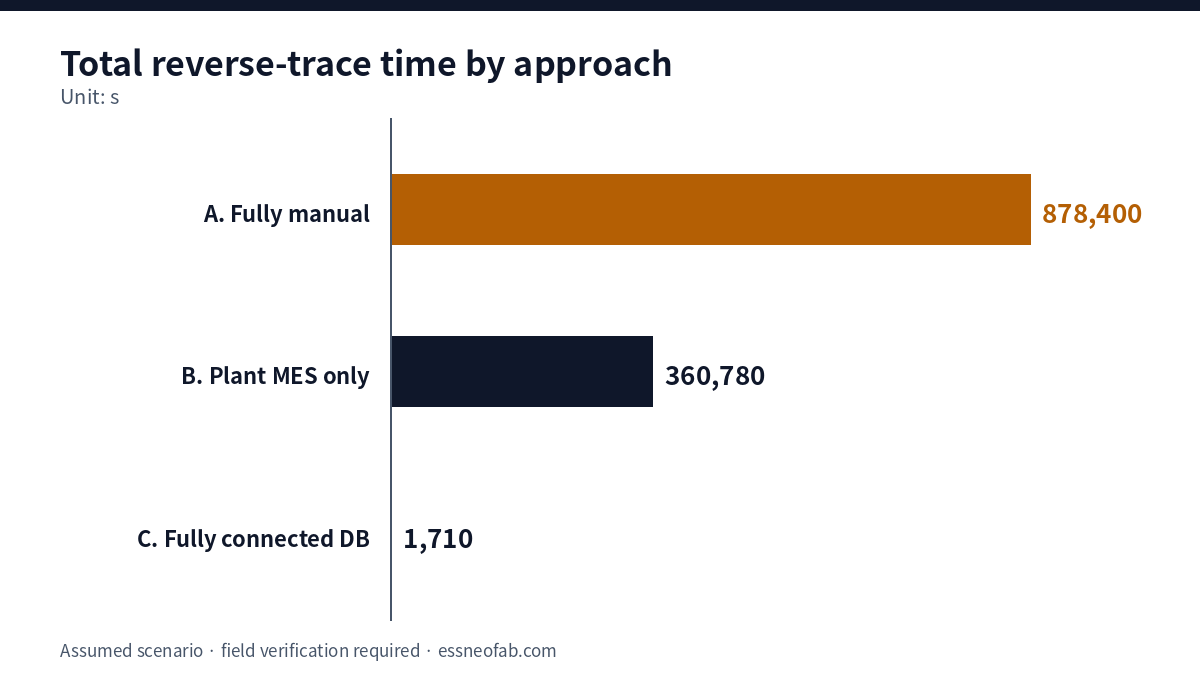
Taking A (878,400 s) as the baseline, B achieves only a 58.9% reduction while C achieves 99.8%. The implication is that of the 360,780 s remaining in B, 360,000 s (99.8%) arises in steps ① and ⑤, i.e., joins outside the factory. Advancing the plant MES is merely a necessary condition; the investment that determines investigation speed is post-shipment installation-position mapping.
The sensitivity of the fan-out structure also needs checking. On the manual path, each additional site adds 28,800 s, whereas on the connected path it adds 75 s. If the same lot were spread across 40 sites, step ⑤ of A alone would reach 1,152,000 s, meaning the gap widens linearly as lot size grows.
4. Cross-Check Against Public Sources and Limits of Application
EPRI’s white paper (May 2024) states that only 26 of 81 incidents could be assigned a root cause, that none of the 9 incidents from 2011 to 2017 could be classified, and that 36% of incidents since 2018 had identified root causes. The same paper attributes the low count of manufacturing root causes to “the difficulty in definitively identifying a manufacturing defect as a root cause with the loss of physical evidence after a fire or explosion.” This article’s interpretation goes one step further. When physical evidence is gone, the only control group available to test a cause hypothesis is other sites where the same lot is installed, and the speed of finding that control group depends on step ⑤.
This view is structurally identical to the approach of Korea’s second investigation team, which cited “analysis of similar batteries in nearby ESS” as a basis. This article does not, however, evaluate the validity of those conclusions; cause determination requires separate review. The point being emphasized is that the data path for identifying identical or similar batteries is a precondition for investigation quality.
- Limit 1: The times in Table 2 are assumed. Actual durations vary widely with contractual data-provision obligations, inter-company security procedures, language and time-zone differences; field verification required.
- Limit 2: Even on the connected path, poor data quality (missing aggregation events, unrecorded ID replacement of reworked cells) breaks the join. Connectivity and completeness must be managed as separate metrics.
- Limit 3: The fact that process parameters were within control limits does not prove the absence of a cause. Reverse tracing narrows the scope of investigation; it does not deliver conclusions.
This differs in grain from NFPA 855 2026 Edition, ESS Rack Design and Traceability Documentation. That article addressed the documentation to be submitted at the design and permitting stage, whereas this one addresses the time required to link data in reverse after an incident. And whereas Cell History Management: Where Does It Break at the Line Level? looked at break points inside the factory, the focus here is that breaks outside the factory account for most of the time.
5. Conclusions and Implications
The value of traceability in an ESS fire investigation lies not in revealing the cause but in quickly locating the control group needed to test a cause hypothesis. In the assumed scenario, full connection reduces the reverse trace to 1,710 s, but connecting only the plant MES leaves 360,780 s. 99.8% of the remaining time lies in joins outside the factory: site as-built records and post-shipment installation positions.
What manufacturers, SIs and owners should agree on first, therefore, is a procedure that registers the module serial ↔ site/rack position mapping in an off-site repository at commissioning completion. Once this single join key is secured, the cost of the fan-out step becomes nearly independent of the number of sites. The numbers depend on assumptions and must be recalculated with in-house cases, but the structure in which the bottleneck lies outside the factory holds even when the assumed values change.
FAQ
Q. What a fire investigation ultimately needs is debris analysis; is data linkage speed really decisive?
A. Debris analysis is essential, and this article does not propose replacing it. As EPRI’s white paper notes, however, once physical evidence is lost it is difficult to confirm a manufacturing defect, and the means left to test a hypothesis are operating data and surviving-cell analysis from other sites with the same lot. If identifying those targets is slow, operating conditions at the other sites may change or cells may be replaced, so the comparable control group itself can disappear.
Q. If a manufacturer refuses to share process parameters citing trade secrets, isn’t a connected database meaningless?
A. Even without sharing raw values, most of steps ④ and ⑤ are resolved if the contract requires only “whether lot-level control limits were exceeded” and “the list of consignees for the same lot” to be provided in the event of an incident. Defining the sharing scope in advance is faster than negotiating after an incident. Specific contract clause design requires separate legal review.
Field Application Notes
The following items can be executed on Monday morning.
| Check | How to execute | Remarks |
|---|---|---|
| ☐ Confirm rack → module mapping for one recently completed site | Check whether the as-built documents contain a digital file of module serials by rack position, and whether a copy exists off-site | If only on-site paper documents exist, step ① is at risk of loss |
| ☐ Run one mock reverse trace | Trace from one arbitrary module serial to cell lot → other consignees of the same lot, recording time per step (s) | Determine where your organization sits among A, B, C in Table 2 |
| ☐ Check reverse-query capability | Verify whether the MES can return “lot → all modules containing that lot” in a single query | Forward-only genealogy is powerless at step ⑤ |
| ☐ Check ID history of reworked/replaced cells | In a sample of recently reworked modules, verify that pre- and post-replacement cell IDs are retained as aggregation events | If missing, the join breaks even with a connected DB |
| ☐ Review contractual data-provision scope for incidents | Check whether supply contracts include clauses on providing lot control-limit exceedance status and same-lot consignee lists | Clause wording requires separate legal review |
Footnotes
[1] Traceability: A system linking identifiers and event records so that a product’s raw material, process, shipment and installation history can be traced forward and backward.
[2] MES (Manufacturing Execution System): A system that collects and manages work orders, output and process data on the line.
[3] Genealogy: A history structure recording parent-child relationships between finished products and their components and lots.
[4] BMS (Battery Management System): The control layer that monitors cell and module voltage, temperature and current and performs protective actions.
[5] SI (System Integrator): The party that integrates and installs components such as batteries, PCS and EMS into a single ESS.
Sources: EPRI, “Insights from EPRI’s Battery Energy Storage Systems (BESS) Failure Incident Database: Analysis of Failure Root Cause”, 2024 White Paper (2024-05), https://restservice.epri.com/publicdownload/000000003002030360/0/Product ; Solar Builder, “Analysis of BESS failure point to battery monitoring, not cell defects” (2024-05-17), https://solarbuildermag.com/energy-storage/analysis-of-battery-storage-system-failures-point-to-monitoring-more-than-cell-defects/ ; Korea Policy Briefing, “ESS accident cause investigation results and safety reinforcement measures” (2019-06-11, Korean), https://www.korea.kr/news/policyNewsView.do?newsId=156335827 ; ZDNet Korea (2019-06-11, Korean), https://zdnet.co.kr/view/?no=20190611103740 ; Edaily, “Investigation team: 4 of 5 ESS fires due to battery anomalies” (2020-02-06, Korean), https://edaily.co.kr/News/Read?mediaCodeNo=257&newsId=01289046625668224 ; The Scoop, “ESS fires: two government investigations, two conclusions” (Korean), https://www.thescoop.co.kr/news/articleView.html?idxno=38254
Measurement & Calculation Conditions: Rack configuration (8 modules × 52 cells, 280 Ah, 3.2 V), 3 cell lots per rack, 12 sites receiving the same lots, parallel processing by lot, and step times (manual 14,400 / 86,400 / 172,800 / 259,200 s and 28,800 s per site; connected DB 30 / 60 / 120 / 600 s and 75 s per site) are all assumed values. Investigating-body approvals, legal procedures and site access restrictions are excluded. Results vary with inter-organizational data-provision terms and data quality; field verification required.


You May Also Like
Why three qualified products landed on the same duration — in DSX Ready BESS, sizing is set by the output axis
When the Station Block Grows to 62 MWh, What Actually Shrinks Is Commissioning Labor, Not Cell Count