Converting EV Lines to ESS: Where Does OEE Break Down?
Abstract
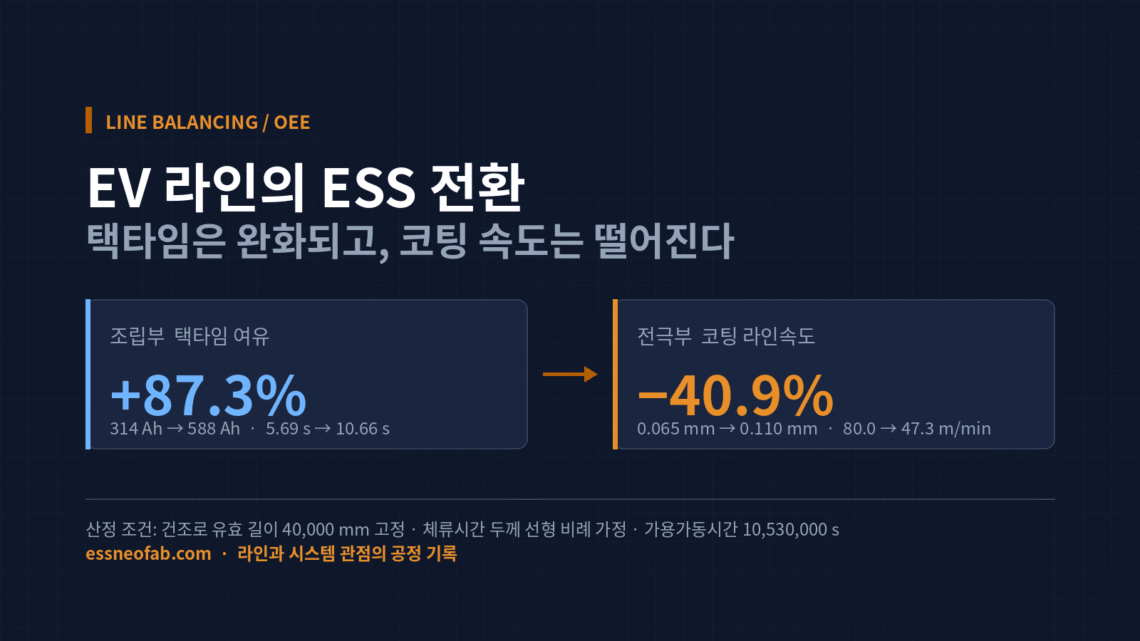
When converting an EV cell line for ESS use, retrofit effort and budget tend to concentrate on the assembly process. However, when a thick-film electrode and a large prismatic cell format are applied simultaneously while the drying-oven length remains fixed, the takt-time margin in the assembly section increases by 87.3% while the coating-section line speed drops by 40.9%. The conversion bottleneck shifts from assembly to the electrode section, and CAPEX priority should be reallocated accordingly. Furthermore, failing to update the abnormal-cycle-time baseline by part number books up to 36.3 percentage points of phantom performance loss into OEE, causing the improvement organization to chase a loss that does not exist.
1. What Breaks First in a Conversion Line Is Not the Equipment — It Is the Metric
This article examines a single assumption under review: “If OEE fell right after conversion, then equipment capability was lost.” The calculation results show this assumption does not hold. A substantial portion of the OEE decline on a conversion line is not equipment loss at all, but a booking error that arises from failing to update the abnormal-cycle-time baseline to match the product change.
The Situation (S) is clear. In H1 2026, the three major domestic battery makers executed a combined KRW 4.32 trillion in capital expenditure (LG Energy Solution KRW 2.69 trillion, Samsung SDI KRW 1.09 trillion, SK On KRW 578.9 billion), and amid slowing EV demand, converting some EV lines to ESS use has been confirmed as an actual CAPEX line item. The Lansing plant in the U.S. began mass production under a mixed-flow structure, producing ESS-use LFP cells and EV-use NCM cells in parallel.
The Complication (C) is that two specification changes arrive at once: electrode thickening and cell-format enlargement (314 Ah → 588 Ah). These two act on line balancing in exactly opposite directions. The Question (Q) that naturally follows is: “What is the first thing to bottleneck in a conversion line?”
The Answer (A) is presented through the calculations in Sections 2 and 3. The conclusion is as follows: in an EV → ESS line conversion, the top-priority review target is not the assembly-equipment retrofit but the electrode-drying capacity, and the OEE used as the basis for that judgment can only be trusted once its metric definition is corrected first.
2. Large-Format Cells Ease Takt-Time Pressure on the Assembly Section
In this article, takt time is fixed as Available Operating Time ÷ Customer Required Quantity. It is not used interchangeably with cycle time or FPY.
Under the same energy-delivery requirement, changing only the cell format produces the calculation results below. Project scale is benchmarked against the actual performance of an Australian grid-connected BESS that recently entered commercial operation (520 MW / 1,858 MWh).
| Item | 314 Ah Prismatic LFP | 588 Ah Prismatic LFP |
|---|---|---|
| Cell energy (nominal 3.2 V) | 1,004.8 Wh | 1,881.6 Wh |
| Cells required for 1,858 MWh | 1,849,124 cells | 987,457 cells |
| Takt time | 5.69 s/cell | 10.66 s/cell |
| Assembly-section margin | Baseline | +87.3% |
Measurement conditions: based on a 6-month delivery schedule, 130 actual operating days at 6 days/week, 22.5 h/day available operating time (3-shift, with 1.5 h/day of planned downtime excluded), for a total available operating time of 10,530,000 s. Nominal voltage is fixed at 3.2 V as a constant for line-level calculation. Internal cell-design variance is excluded as a controlled variable in this calculation.
The implication is straightforward. Because the number of cells to be handled to deliver the same energy decreases by 46.6%, the time the assembly line can spend per cell increases by roughly 1.87×. This does not mean the assembly-section retrofit becomes unnecessary, but from a speed standpoint, the pressure actually eases after conversion.
3. Thick-Film Electrodes Raise the Pressure on the Electrode Section
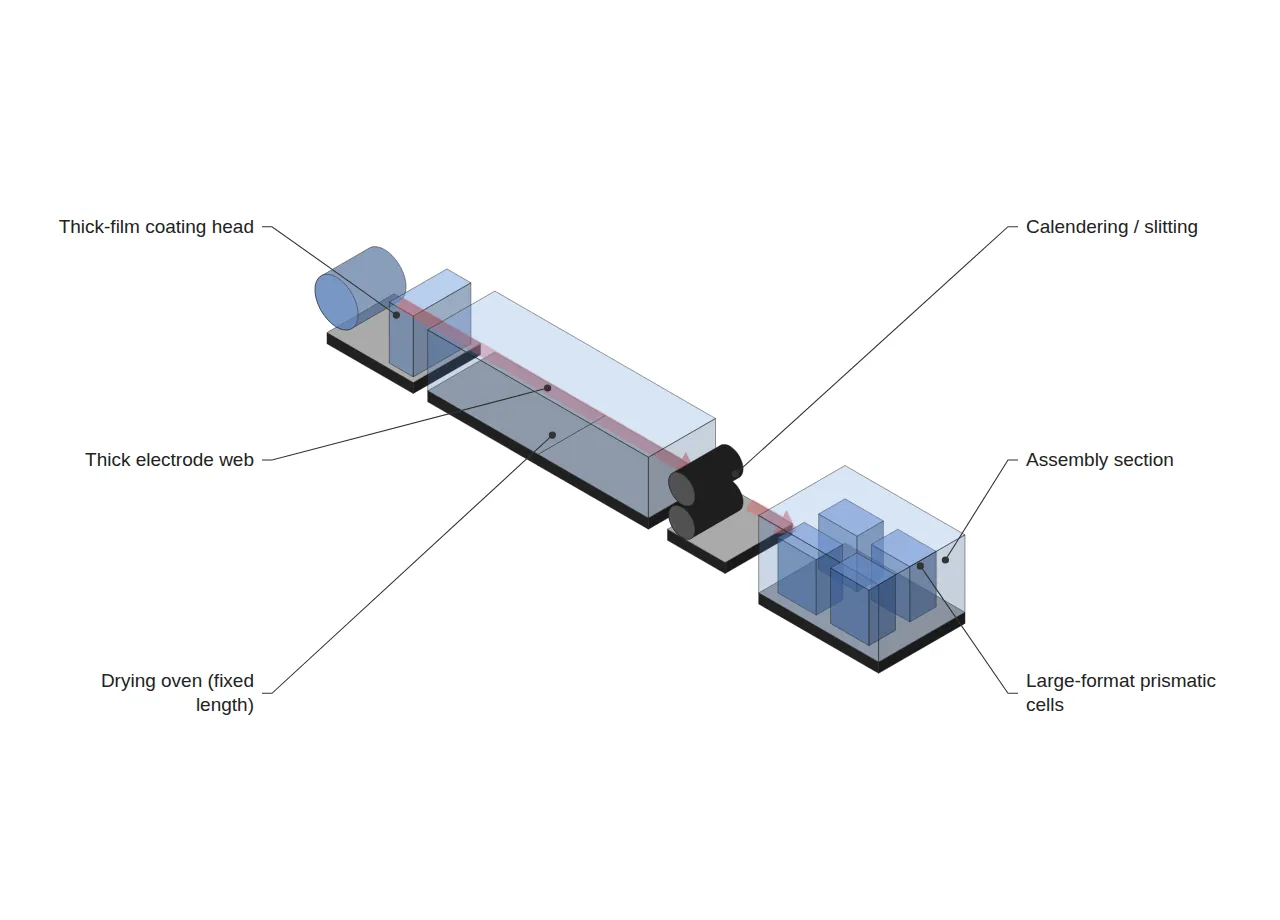
The electrode section moves in the opposite direction. ESS-use LFP requires a thicker coating than EV-use NCM, and on an existing line with a fixed drying-oven length, an increase in thickness shows up directly as a drop in line speed.
| Item | EV-use NCM | ESS-use LFP (thick film) |
|---|---|---|
| Single-side coating thickness | 0.065 mm | 0.110 mm |
| Required drying dwell time | 30.0 s | 50.8 s |
| Coating line speed | 80.0 m/min | 47.3 m/min |
| Line-speed change | Baseline | −40.9% |
Measurement conditions: drying-oven effective length fixed at 40,000 mm (identical before and after conversion), with hot-air temperature and airflow conditions held constant. Dwell time is assumed to be linearly proportional to coating thickness. Because actual drying increases nonlinearly — between the 1st and 2nd power of thickness in the diffusion-limited regime — the −40.9% figure above should be read as an optimistic lower bound. The heat- and mass-transfer behavior internal to any individual drying unit falls outside the scope of this article and requires separate review.
One observation is worth adding here. If dwell time is held linearly proportional to thickness, the volumetric throughput index (line speed × coating thickness) is conserved at 5.200 both before and after conversion. In other words, the coater continues to process the same volume, yet the speed gauge reads 40.9% lower. This is precisely where the on-the-floor perception that “the equipment has gotten slower” originates. What has actually slowed down is not the equipment, but the condition the product demands.
Combining the two sections confirms the bottleneck has shifted. The assembly section gains an 87.3% margin while the electrode section loses 40.9% of its capacity. It is reasonable that conversion CAPEX be allocated first to drying-oven expansion floor space and thick-film-capable coating capacity, rather than to assembly jigs and format-change fixtures.
4. Failing to Update the Baseline Books a Loss That Does Not Exist
In this article, OEE is fixed as Availability × Performance × Quality. Of these, the Performance factor is dependent on the abnormal-cycle-time baseline. This is where conversion lines typically fall into a trap.
| Category | Availability | Performance | Quality | OEE |
|---|---|---|---|---|
| Baseline not updated (NCM baseline retained) | 90.0% | 59.1% | 98.5% | 52.4% |
| Baseline updated per part number | 90.0% | 100.0% | 98.5% | 88.6% |
| Difference | — | — | — | 36.3%p |
Calculation conditions: Availability and Quality were held fixed as controlled variables at 90.0% and 98.5% respectively, with only the Performance factor varied, for an extreme-case comparison. This assumes full-line conversion to LFP thick film; the gap narrows proportionally as the mixed-flow ratio decreases.
36.3 percentage points is not a loss that can be recovered through improvement activity. It is a loss that does not exist. If the baseline remains set at the NCM-based 80.0 m/min while a line running at 47.3 m/min is evaluated against it, Performance books in at 59.1%, and the improvement organization ends up chasing, over an extended period, something that is neither an equipment failure nor a momentary stoppage.
The opposite error must be guarded against as well. If the baseline is unconditionally lowered to match the measured value, the real loss is absorbed into the baseline and disappears. The practical solution therefore narrows to one: managing abnormal cycle time as a product attribute rather than a line attribute — that is, maintaining a separate abnormal-cycle-time master by part number, keeping a change history, and calculating line OEE by referencing that master.
5. Mixed-Flow Line Tallying Should Be by Time, Not by Count
The moment LFP and NCM, or 314 Ah and 588 Ah, mix on a single line, another distortion appears. When the Quality factor is tallied by cell count, the weight of a large-cell defect disappears.
A 588 Ah cell carries an equivalence factor of 1.873 relative to a 314 Ah cell — meaning that producing one cell requires roughly 1.87× the line time. Compare a batch of 500 units of 588 Ah and 500 units of 314 Ah cells, where 20 defects occur only among the 588 Ah cells.
| Tallying method | Quality factor | Judgment |
|---|---|---|
| Count-based | 98.00% | Loss underestimated |
| Time (equivalence-factor)-weighted | 97.39% | Reflects actual loss |
| Difference | 0.61%p | — |
0.61 percentage points looks small, but the gap widens as the share of large cells increases and as defects concentrate more heavily in large cells. Above all, this distortion always runs in one direction: count-based tallying, without exception, produces a number better than reality. In effect, it uses a statistically biased estimator as the metric.
In summary, on a mixed-flow conversion line, all three OEE factors must be redefined on a time basis. Availability is already time-based; Performance should reference the abnormal-cycle-time master by part number; and Quality should be calculated with equivalence-factor weighting. Only once all three are in place can a before/after OEE comparison speak to a “statistically meaningful difference.”
FAQ
Q1. Could raising the drying hot-air temperature to shorten dwell time offset the line-speed loss?
This is answered strictly from a line perspective. Raising the drying rate is known to affect binder behavior and electrode surface quality, which falls within the internal heat- and mass-transfer domain of individual equipment; this article does not make a determination on that point, and separate review is needed. From a line-balancing standpoint, however, the actual constraint usually lies elsewhere: the floor space before and after the existing drying oven, the length of the return tension zone, and speed matching with the downstream rolling and slitting processes. Even if drying-oven conditions are adjusted, if the upstream and downstream process speeds cannot keep up, the bottleneck merely relocates.
Q2. Does splitting abnormal cycle time by part number make line-level OEE comparison impossible?
The opposite is true. Applying time-based weighting actually makes comparison possible. If the Performance factor is defined as Σ(production quantity_i × abnormal cycle time_i) ÷ operating time, the result converges to a single dimensionless ratio regardless of how many part numbers are involved. It is, in fact, the existing method — counting by number without a per-part-number baseline — that becomes incomparable, since the metric shifts every time the product mix changes.
Q3. Can pilot-line verification results be applied directly to a mass-production line?
This is not recommended. The calculations in this article are relative comparisons derived under controlled assumptions, not values that guarantee absolute performance. In particular, the assumption of a linear relationship between dwell time and thickness is an optimistic lower bound, so before applying this to mass production, the drying curve should be measured and calibrated by thickness range on the actual line. A one-to-one application of pilot results requires additional verification.
Field Application Notes
Organized as items that can be started Monday morning — completable within the first two weeks of the conversion review.
| # | Action Item | Deliverable | Judgment Criterion |
|---|---|---|---|
| 1 | Confirm whether a per-part-number abnormal-cycle-time master exists | Part-number-to-abnormal-CT cross-reference table | Immediate action required if no master exists or only a single line-wide value is used |
| 2 | Decompose the Performance factor of OEE over the past 6 months | Pareto chart of performance-loss factors | Suspect a baseline error if the residual unexplained by equipment factors is 10 percentage points or more |
| 3 | Measure the drying oven’s effective length and the available floor space before/after it | Oven length (mm), expandable length (mm) | If there is no room to expand, redirect the CAPEX item to coating-line expansion |
| 4 | Measure drying dwell time by coating-thickness range | Thickness-vs-dwell-time curve | If the excess over the linear assumption is 20% or more, recalculate line speed |
| 5 | Confirm whether the quality tally is count-based | Quality-calculation logic specification | If count-based, switch to equivalence-factor weighting |
| 6 | Compare the assembly section’s actual cycle time against the new takt time | Margin (%) | If the margin exceeds 50%, review reallocating the assembly-retrofit budget to the electrode section |
Item 1 is the first thing to confirm. If no per-part-number abnormal-cycle-time master exists, every OEE comparison that follows has been made on an unstable baseline, and is difficult to use as grounds for a conversion decision.
Related Reading
- Dry Electrode, Where Does the Line Bottleneck Move?
- Inter-Process Buffers: Bigger Isn’t Always Better
- BMS, PCS, EMS: Why Do the Three ESS System Layers Move at Different Speeds?
References
- Korea’s Three Battery Makers Execute KRW 4.32 Trillion in H1 2026 CAPEX — The Korea Herald, 2026-08-18. View Article
- LG Energy Solution Announces Start of Production at All-New Lansing Battery Plant (Parallel ESS-use LFP / EV-use NCM) — PR Newswire, 2026-08-18. View Article
- China’s July 2026 EV Battery Installations Reach 74.6 GWh, LFP Share 84.6% — CnEVPost, 2026-08-18. View Article
- Australia’s Supernode BESS Enters Commercial Operation at 520 MW / 1,858 MWh, Contracts 314 Ah and 588 Ah Cell Frames — EnergyTrend, 2026-08-18. View Article
- Analysis of ESS↔EV Production-Capacity Conversion — SMM, 2026-08-17. View Article


2 Comments
Pingback:
Pingback: