Battwoo’s Second-Life EV Batteries — When an 80 % Acceptance Threshold Overlaps the Retirement Distribution, Incoming Screening Becomes the Bottleneck
Abstract
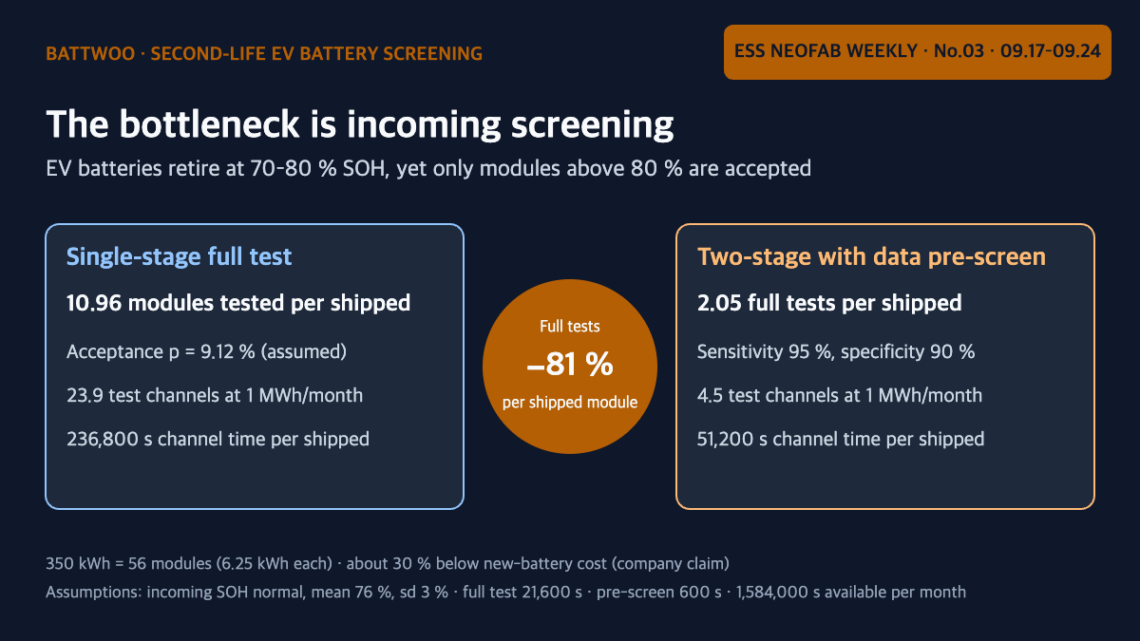
French startup Battwoo refurbishes into stationary ESS only those retired EV batteries that retain more than 80 % of their capacity, while EV batteries typically retire at 70–80 %, and it says a 500 kWh system costs about 30 % less than one built with new batteries¹. When the retirement distribution and the acceptance threshold overlap like this, the acceptance rate is low: assuming incoming SOH with a mean of 76 % and a standard deviation of 3 %, the acceptance rate is 9.1 %, so 11.0 modules must be tested for every module shipped. At an assumed 1 MWh per month of shipments, 23.9 full-capacity test channels are needed, about 11 times the 2.2 channels needed if everything passed. A first-stage screen based on data such as BMS history (95 % sensitivity, 90 % specificity) cuts full-capacity tests to 2.05 per shipped module, an 81 % reduction, which makes the design variable of a second-life line the data quality at the incoming interface rather than assembly capacity.
1. Conclusion First — The Bottleneck of a Second-Life Line Is Incoming Screening
The throughput of a second-life battery line is set by screening tests, not by assembly. The screening volume is proportional not to shipments but to “shipments ÷ acceptance rate,” and the acceptance rate is set by how much the retirement distribution overlaps the acceptance threshold. The biggest lever for shrinking screening equipment is therefore not shorter tests but data that remove rejects before they are tested.
Situation (S): EV batteries end their first life at 70–80 % of remaining capacity, and after diagnostics and testing (in-house and by an accredited laboratory) Battwoo rebuilds only those above 80 % into stationary systems at its Madrid workshop¹. Complication (C): the upper end of the retirement band and the acceptance threshold are both 80 %, so accepted units come only from the tail of the distribution. Question (Q): how large does the screening equipment become, and what can shrink it? Answer (A): about elevenfold under the assumed distribution, and two-stage screening can bring it down to about one-fifth.
| Item | Published content | Use in this article |
|---|---|---|
| Remaining capacity at retirement | 70–80 % | Basis for the incoming-distribution assumption |
| Acceptance criterion | Only units above 80 % are refurbished | Acceptance-rate calculation |
| Installed example | 350 kWh = 56 modules (capacity of five EVs) | Derives 6.25 kWh per module |
| Price | 500 kWh system about 30 % below new-battery equivalent | Reference (cannot be decomposed) |
| Operation | Up to four cycles per day, full traceability | Reference |
| Scale-up plan | Below 500 kWh → 1 MWh → 2 MW or 3 MWh | Basis for the assumed monthly shipments |
2. Mechanism — The Inverse of the Acceptance Rate Is the Multiplier on Test Equipment
When the state of health (SOH)² of incoming modules forms a distribution and the acceptance threshold is 80 %, the acceptance rate p is the share of the distribution above 80 %. Because 1/p modules must be tested to obtain one shipped module, the test equipment grows by 1/p even at the same shipment volume. Assuming a mean SOH of 76 % and a standard deviation of 3 %, p = 9.12 % and 10.96 modules are tested per shipped module.
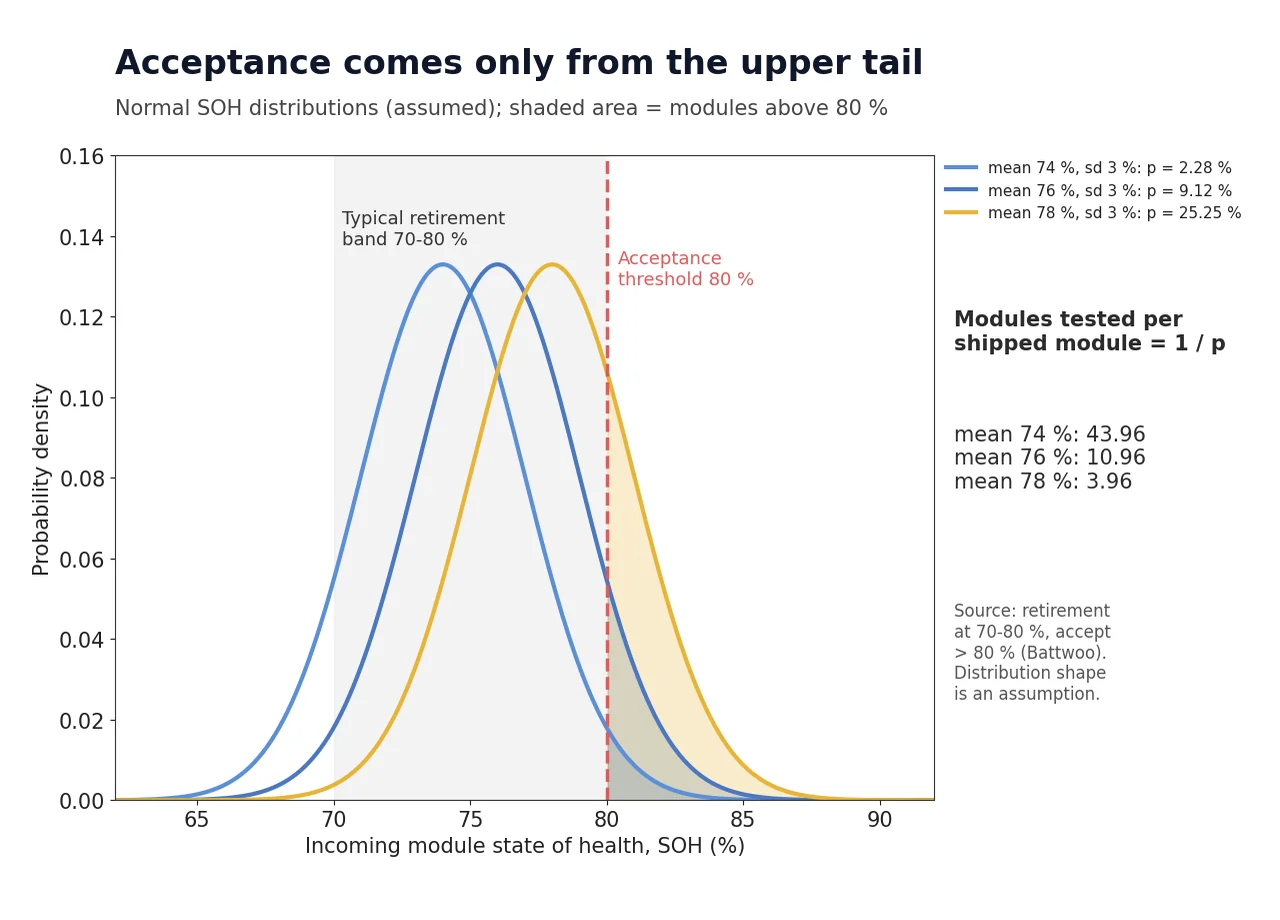
| Incoming SOH distribution (assumed) | Acceptance rate p (> 80 %) | Tests per shipped module |
|---|---|---|
| Mean 74 %, standard deviation 3 % | 2.28 % | 43.96 |
| Mean 76 %, standard deviation 3 % (base case) | 9.12 % | 10.96 |
| Mean 78 %, standard deviation 3 % | 25.25 % | 3.96 |
| Mean 82 %, standard deviation 3 % (selective sourcing) | 74.75 % | 1.34 |
※ Calculation conditions: normally distributed incoming SOH assumed (the 70–80 % band in the source interpreted as a mean of 76 %), module-level judgment, measurement error ignored. Implication: when the mean SOH falls by 2 percentage points, the number of tests roughly quadruples, so the mean SOH of a sourcing lot is as important a purchasing specification as price.
3. Calculation — Screening Channels Seen Through Takt Time, and the Effect of Two-Stage Screening
With a monthly available operating time of 1,584,000 s (20 days × 22 h, assumed) and monthly shipments of 1 MWh = 160 modules, the shipment-based takt time (= available operating time / customer-demanded quantity) is 9,900 s per module. The screening process, however, must handle 160 ÷ 0.0912 = 1,754 modules, so its takt time shortens to 903 s per module. With a full-capacity test of 21,600 s per module (assumed), the number of parallel test channels needed is 21,600 ÷ 903 = 23.9, about 11 times the 2.2 channels needed if every module passed (p = 1).
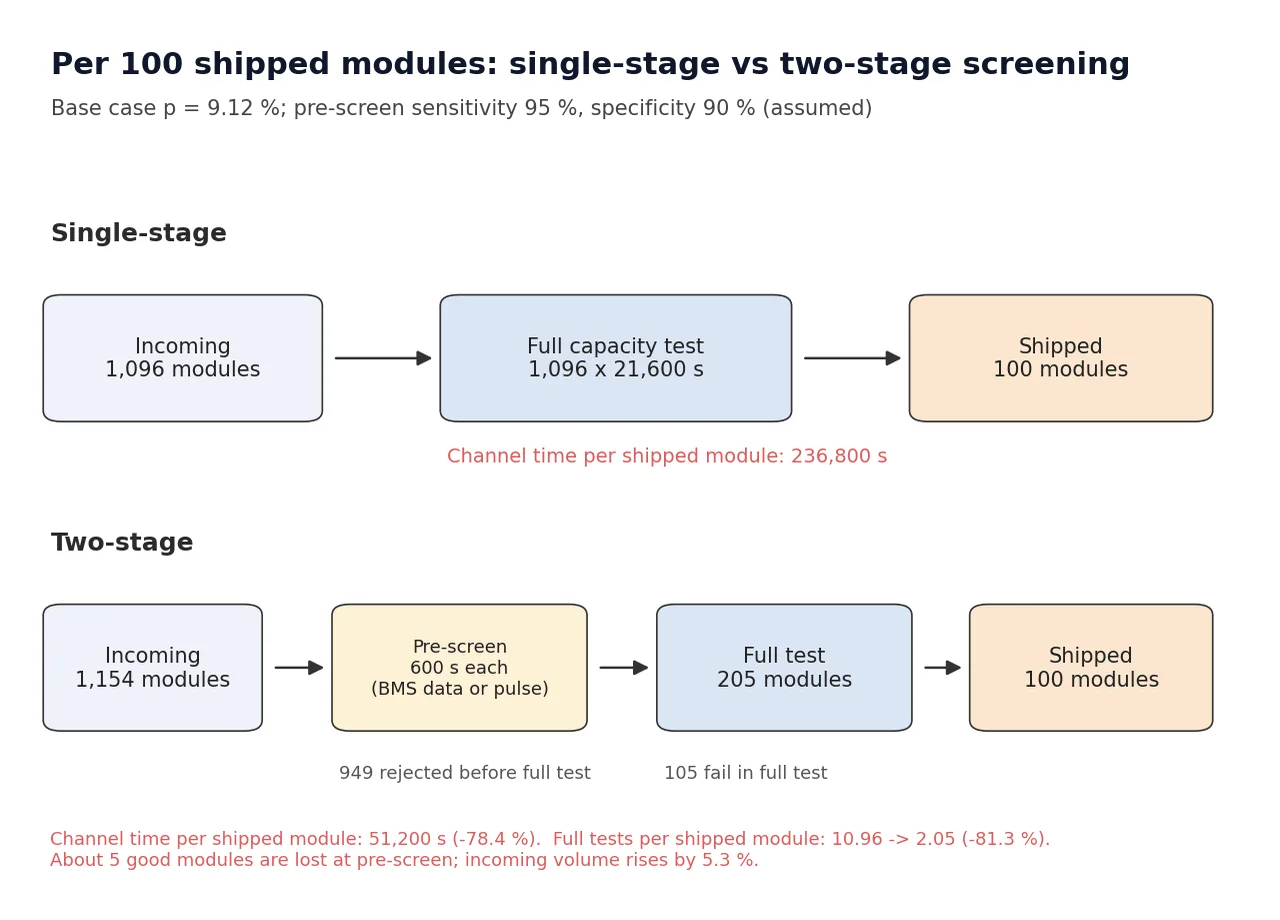
Two-stage screening first removes modules that are likely to fail, using BMS operating history or a short pulse test. With a first-stage sensitivity (probability of passing a good module) of 95 % and a specificity (probability of rejecting a bad module) of 90 %, 17.75 % of incoming modules go on to the full-capacity test, and full tests per shipped module fall to 2.05. At the cost of losing 5 % of good modules, incoming volume rises from 10.96 to 11.54 per shipped module (+5.3 %), but channel occupancy per shipped module drops from 236,800 s to 51,200 s (−78.4 %).
| Metric (1 MWh shipped per month) | Single-stage full testing | Two-stage screening (first stage 600 s) | Change |
|---|---|---|---|
| Incoming modules per month | 1,754 | 1,846 | +5.3 % |
| Full-capacity tests per shipped module | 10.96 | 2.05 | −81.3 % |
| Full-capacity test channels | 23.9 | 4.5 | −81.3 % |
| Channel occupancy per shipped module | 236,800 s | 51,200 s | −78.4 % |
| Pass rate in full testing (positive predictive value) | 9.1 % | 48.8 % | Less wasted testing |
※ Calculation conditions: sensitivity, specificity, the 600 s first-stage test, the 21,600 s full test, available operating time and monthly shipments are all assumptions. The baseline is “full-capacity testing of every incoming module,” and first-stage performance must be confirmed by lot-level measurement.
4. Line and System Perspective — Moving the First Stage Before Receipt Also Cuts Logistics
If the first stage is a data lookup, it can be performed before the modules arrive at the workshop. In that case the number of modules transported falls from 10.96 to 2.05 per shipped module, so the burden of transporting and storing used batteries falls by 81 % along with the test channels. The most important interface of the second-life line then becomes the data link between the sourcing partner and the workshop.
The EU Battery Regulation (Regulation (EU) 2023/1542) requires a battery passport for EV batteries and other categories from February 18, 2027, and the passport includes data related to state of health³. How far passport data will raise the sensitivity and specificity of the first stage has not yet been measured, so it must be verified lot by lot when applied. Classifying modules by having the BMS compare cell voltage curves against a reference curve (EP4196805A1)⁴ and a two-stage structure that sends only cells judged low-quality in a high-throughput check to a comprehensive check (US20220404431A1)⁵ are known as general prior art.
This article sits on a different layer from #528 (the probability that a second-life rack’s history stays continuous) and #530 (grading bins and WIP for new cells). Where #528 dealt with the probability that history is broken and #530 with grade-waiting inventory for new cells, this article deals with how the overlap between the retirement distribution and the acceptance threshold sets the size of the screening equipment. The channel-count method is the same as in #319 (formation channels = dwell time ÷ takt time), but here the demanded quantity is multiplied by the inverse of the acceptance rate.
5. Conclusion and Limitations
As long as the acceptance threshold sits at the top of the retirement distribution, a second-life line’s screening equipment must be designed for shipments ÷ acceptance rate, not for shipments. Under the assumed distribution this multiplier is about 11, and two-stage screening lowers it to about 2. Whether the roughly 30 % price advantage Battwoo reports holds after scale-up is likely to depend on the mean SOH of sourcing lots and the accuracy of the first-stage screen.
As limitations, the incoming SOH distribution, test times, sensitivity and specificity are all assumptions, and the source does not state whether the 80 % criterion applies at module or pack level. The cost structure behind the 30 % price advantage is not disclosed and cannot be linked directly to this calculation, so further verification with measured lot data is needed.
FAQ
Q1. Wouldn’t lowering the acceptance threshold to 75 % solve the problem?
Under the same assumed distribution, the share above 75 % is 63.1 %, and the test multiplier falls to 1.6. However, the second-life period shortens and module-to-module variation widens, which is closer to moving the equipment problem into a lifetime and matching problem. The threshold should be derived backward from the warranted lifetime, not from equipment efficiency.
Q2. Couldn’t the full-capacity test time simply be halved?
The channel count is proportional both to test time and to the inverse of the acceptance rate, so halving test time halves the channels. As long as the acceptance rate is 9.1 %, however, 91 % of tests are still spent on rejects. Comparing the two levers, the first-stage screen is more effective because it cuts channels by 81 % while eliminating the wasted tests themselves.
Q3. Isn’t losing 5 % of good modules at the first stage a loss?
It is a loss. In exchange, incoming volume rises by 5.3 % while channel occupancy falls by 78.4 %. Because raising sensitivity usually lowers specificity, the combination of the two should be set by the ratio between channel cost and sourcing price.
Field Application Notes
| Check | How to execute | Decision criterion | Remarks |
|---|---|---|---|
| ☐ Record the incoming SOH distribution | Accumulate mean SOH, standard deviation and acceptance rate per sourcing lot | Estimate p per lot | Replaces the distribution assumption |
| ☐ Change the channel-count basis | Size test channels by incoming volume (shipments ÷ p), not by the shipment target | Screening takt ≥ test time ÷ channel count | Assumed example: 903 s per module |
| ☐ Measure first-stage performance | Compare first-stage judgments with full-test results monthly to compute sensitivity and specificity | Target 95 % sensitivity and 90 % specificity | Assumed target |
| ☐ Define the data interface | Document the fields, format and timing of BMS history and battery-passport data received from sourcing partners | Can judgment be made before receipt? | Prepare for the passport from 2027-02-18 |
| ☐ Secure the reject path | Set storage space and hand-over intervals for rejected modules going to recycling | Upper limit on modules waiting for hand-over | Safety criteria to be confirmed |
Sources and Notes
¹ G. Deboutte, “French startup repurposes EV batteries for solar energy storage,” pv magazine, 2026-09-21; ESS News reported the same day. Remaining capacity of 70–80 % at retirement, refurbishment of units above 80 %, 350 kWh = 56 modules, about 30 % price advantage, up to four cycles per day and the scale-up plan are cited.
² SOH (State of Health): battery health expressed as the ratio of present capacity to rated capacity. In this article it is used in the same sense as the remaining-capacity ratio.
³ Regulation (EU) 2023/1542 (EU Battery Regulation): battery passport mandatory from 2027-02-18 for EV batteries, industrial batteries above 2 kWh and LMT batteries. Passport data fields to be confirmed against implementing guidance.
⁴ EP4196805A1, “Battery management system for classifying a battery module,” Lisa Dräxlmaier GmbH, published 2023-06-21 (patents.google.com). Cited as general prior art.
⁵ US20220404431A1, “Method of analyzing the quality of a battery cell by performing a comprehensive quality check on battery cells assessed as low-quality from a high-throughput quality check,” GM Global Technology Operations LLC, published 2022-12-22 (patents.google.com). Cited as general prior art.
※ Patent search: no new patents were found in the most recent 7 days by publication date, so the search was widened to 30 days, still with no new relevant patents.
※ The incoming distribution, test times, available operating time, shipments and first-stage performance are all assumed scenarios and require verification against measured data.
Other Articles in This Issue
- Pylontech’s 588 Ah and 601 Ah LFP Cells Enter Mass Production — Why Energy-Weighted Availability Stays the Same When the Cell Count Halves
- CATL Starts Trial Production in Debrecen — The Digits of the Defect-Rate Target, Not the Equipment, Set the Length of a Trial Run


You May Also Like
Five million ACC cells equal 2.7 to 3.6 months of nameplate output
Between the Continuous Solid-Electrolyte Process and the Assembly Line: How Should the Buffer Interface Be Designed?