-
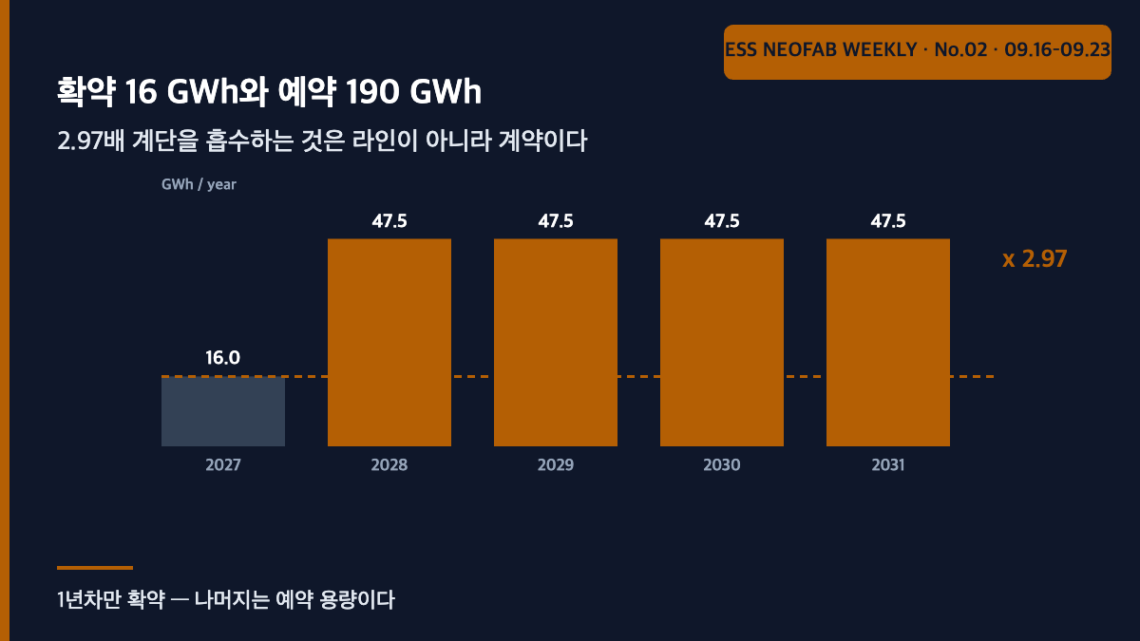
16 GWh committed and 190 GWh reserved — what absorbs the 2.97x step is the contract, not the line
The EVE Energy - Fluence framework of up to 206 GWh for 2027-2031 turns on how it is split: only 16 GWh for 2027 is committed, the remaining 190 GWh is reserved capacity. At an assumed 6 GWh/yr per line that is a 2.97x step from three lines to eight - five more within a year - yet backing out an 18-month lead time shows the step was already 2.6 months late at disclosure. What absorbs the step is the contract wording, not the line.
You May Also Like
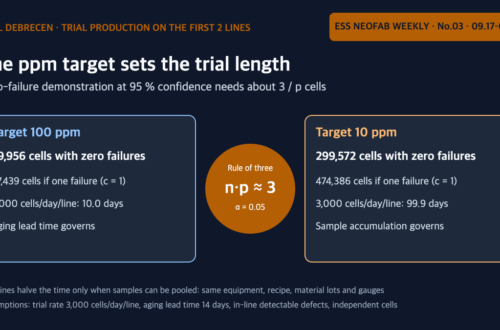
CATL Starts Trial Production in Debrecen — The Digits of the Defect-Rate Target, Not the Equipment, Set the Length of a Trial Run
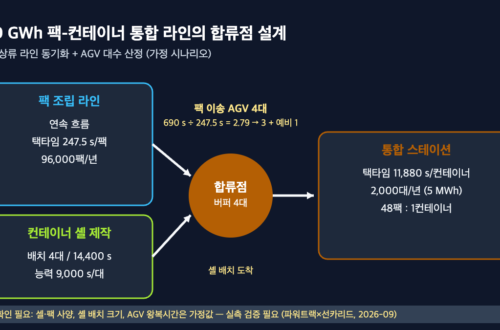
Designing the Merge Point in a 10 GWh Pack-Container Integration Line: Synchronizing Two Upstream Lines and Sizing AGV Fleet from the Powertrac × Sunka Lead Order
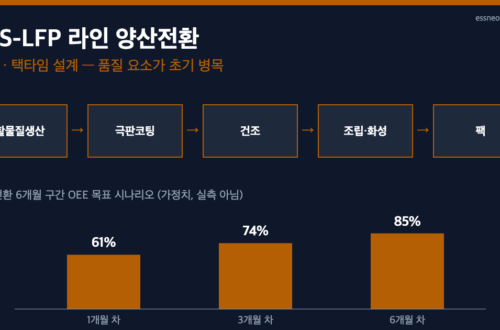
The Equipment Maker’s Line-Ownership Shift — OEE and Takt-Time Design During the ESS-LFP New-Line Mass-Production Ramp-Up
-
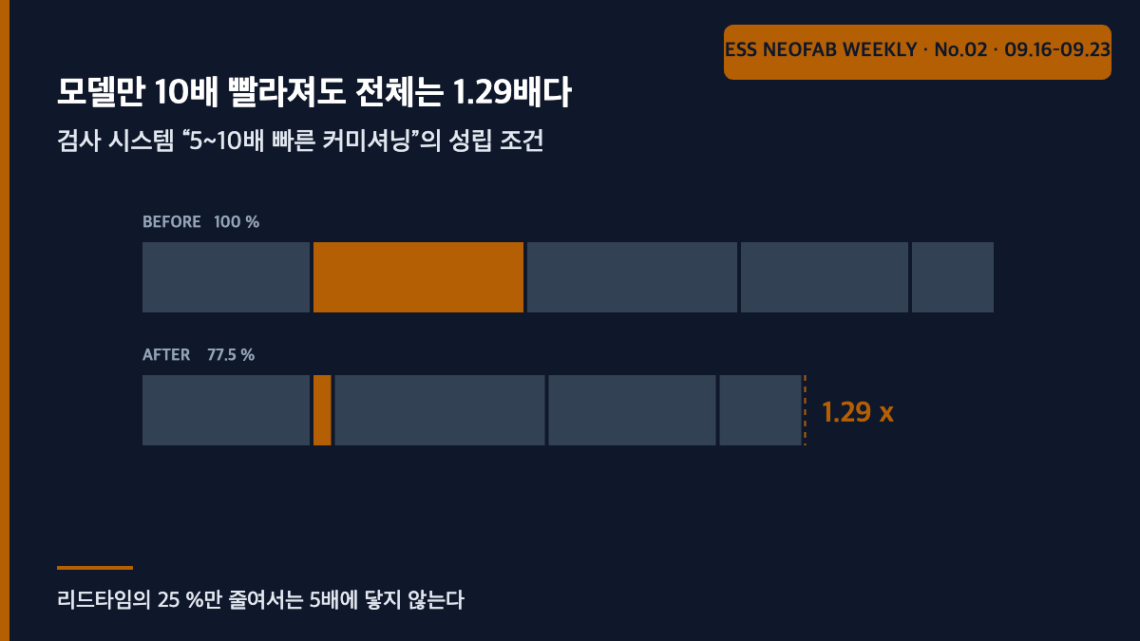
Even a tenfold faster model moves the whole by 1.29x — what “5 to 10 times faster commissioning” actually requires
Siemens and P&G announced on 18 September 2026 that their VIC inspection platform commissions new deployments 5-10x faster. Re-read through Amdahl's law, accelerating the model stage (assumed 25 % share) tenfold shortens the whole by only 1.29x (22.5 %). For 5x to hold the accelerated scope must exceed 88.9 %, and 10x at a partial factor of 5 is arithmetically impossible. The bottleneck is not AI but the standardisation of lighting, mechanics, integration and handover.
You May Also Like
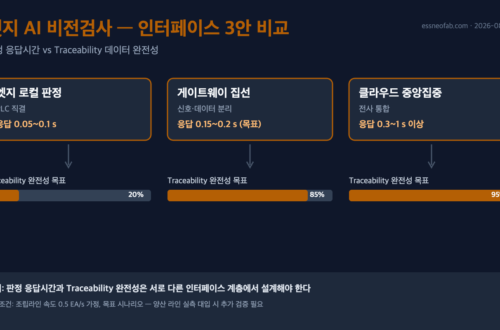
Edge AI Vision Inspection and Battery-Pack Leak Testing: How Gateway Aggregation Affects Traceability Completeness
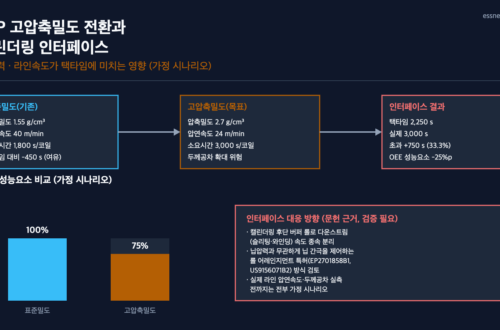
LFP High-Compaction-Density Conversion and the Calendering Interface: How Nip Pressure and Line Speed Affect Takt Time
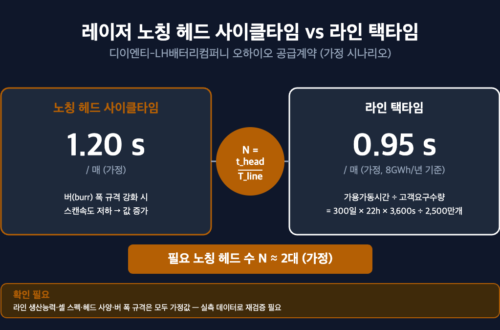
The Interface Between Laser Notching Cycle Time and Line Takt Time — The Head-Count Sizing Problem Revealed by DI ENT’s Ohio Supply Contract
-
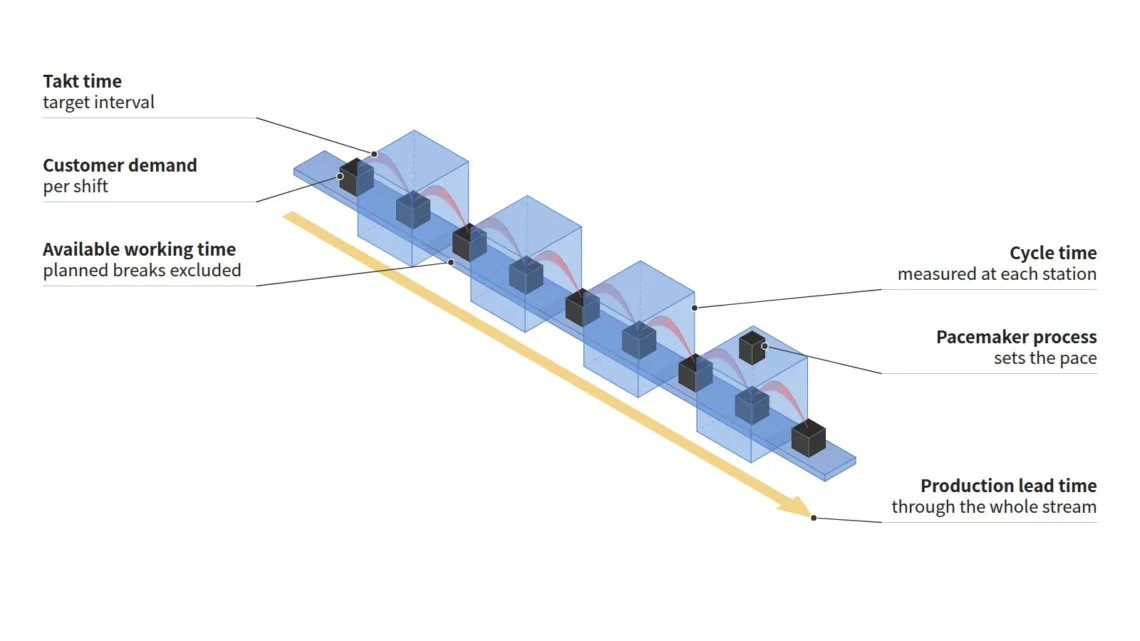
Don’t Subtract Breakdowns When Calculating Takt Time — Takt Time vs. Cycle Time vs. Lead Time
Takt time is the target production interval obtained by dividing available working time by customer demand, whereas cycle time is the measured time a process actually takes to make one unit. The calculation rule in the workbook published by the Lean Enterprise Institute (LEI) subtracts from shift time planned operator breaks, meetings, cleanups, etc., but not time for unplanned machine downtime, changeovers or other internal problems. Dividing the 27,600 s of available working time per shift obtained under this rule by the demand per shift of 690 units gives a takt time of 40 s. To cover stopped time as well, the measured cycle time must be shorter than takt…
You May Also Like
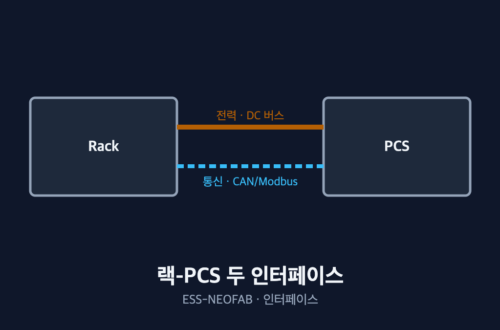
Between the Battery Rack and the PCS: Two Points Where the Interface Diverges
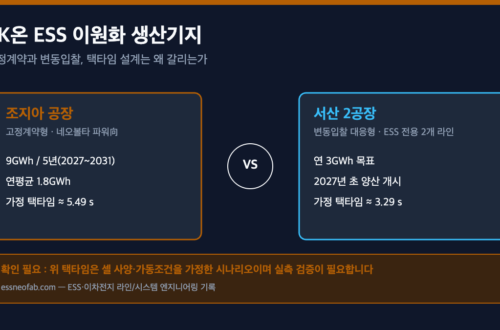
SK On’s Dual-Site ESS Production Bases — Where Fixed Contracts and Variable Bidding Split Takt Time Design

Even a tenfold faster model moves the whole by 1.29x — what “5 to 10 times faster commissioning” actually requires
-
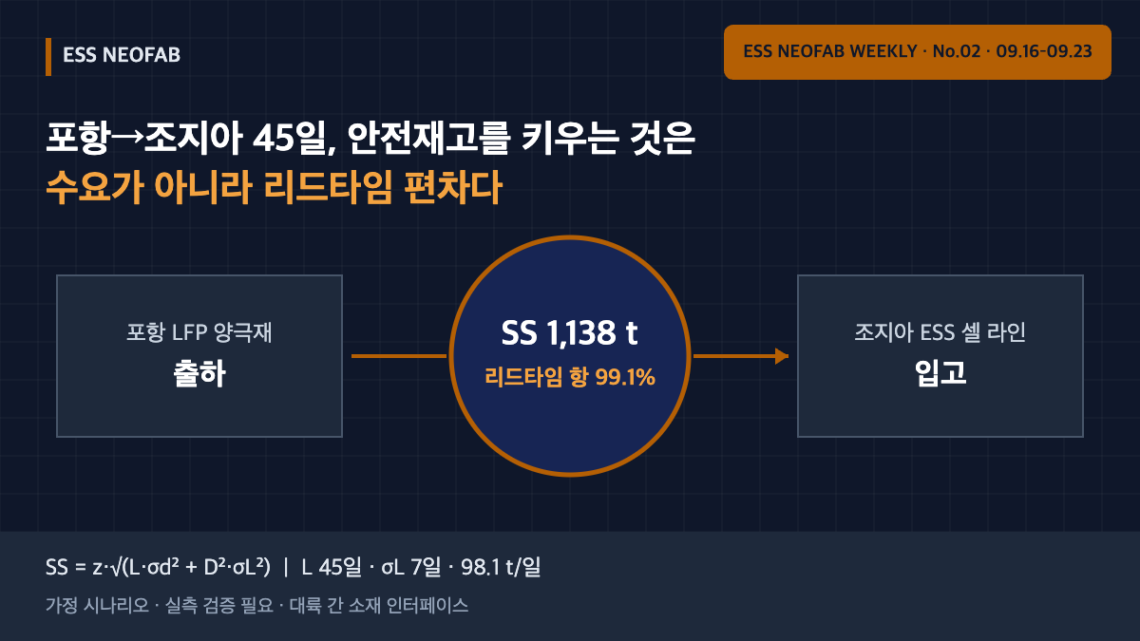
45 Days from Pohang to Georgia — Safety Stock at an Intercontinental Cathode Interface Is Driven by Lead-Time Variability, Not Demand
SK On’s roughly KRW 1.0742 trillion LFP cathode contract with POSCO Future M (2027–2029, for its Georgia ESS cell line) puts a continent and an ocean crossing between the materials and cell plants. Under an assumed scenario (45-day lead time, σL 7 days, 98.1 t/day), safety stock in front of the Georgia cell line is about 1,138 t, 99.1% of which comes from the lead-time variability term. Halving lead-time variability cuts it to 577 t; halving demand variability leaves it at 1,136 t. At an intercontinental interface, the management variable is the spread of arrival times, not the demand forecast.
You May Also Like
Edge AI Vision Inspection and Battery-Pack Leak Testing: How Gateway Aggregation Affects Traceability Completeness
Between the Battery Rack and the PCS: Two Points Where the Interface Diverges
The Interface Between Laser Notching Cycle Time and Line Takt Time — The Head-Count Sizing Problem Revealed by DI ENT’s Ohio Supply Contract