EU Battery Carbon Footprint Methodology Still Pending: How Line Energy Metering Resolution and Allocation Choice Shift Per-Cell Values
Abstract
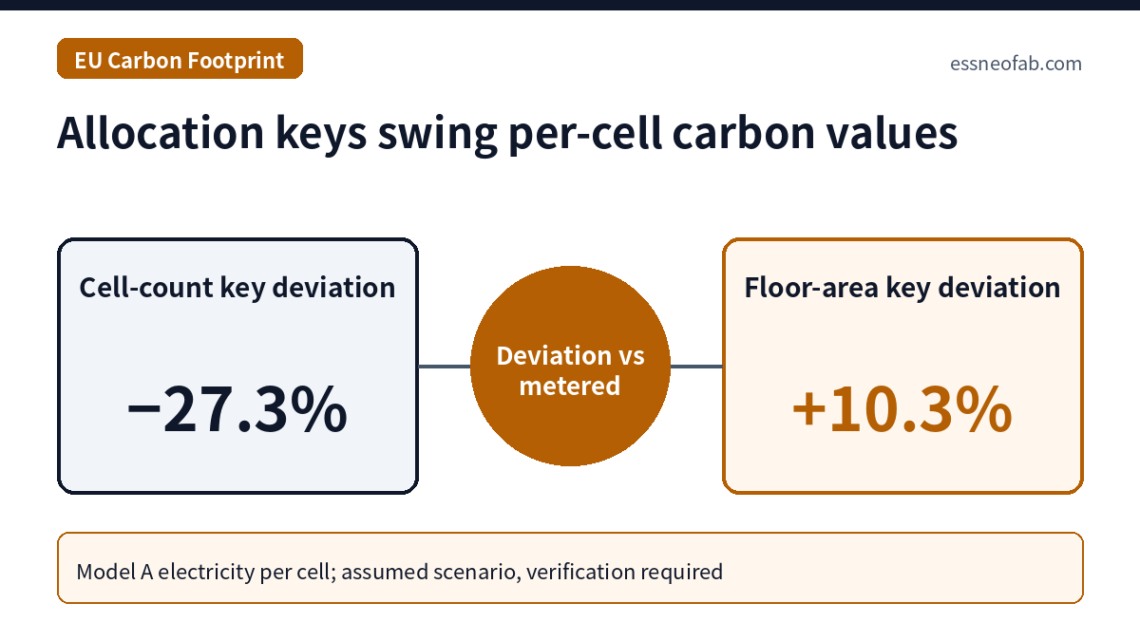
According to the EU’s official consultation portal, the delegated act setting the carbon footprint calculation methodology under Article 7 of the EU Batteries Regulation (2023/1542) had not moved to the adoption stage as of 23 September 2026, and the portal still shows the planned adoption period as “Q3 2025”. In an assumed 8 GWh/year plant producing two models, allocating the same 200,000,000 kWh of electricity by floor area, operating time, capacity or cell count makes the per-cell electricity of model A swing from −27.3% to +10.3% against the process-metered value of 7.860 kWh.
Area-based allocation reverses the low-carbon ranking of the two models, and capacity-based allocation has the smallest total error but by definition sets the difference between models to zero. Because the spread between allocation methods is larger than the seasonal batch variation (±7.0%), it is rational to secure “process × model sub-metering” before time resolution in metering investment.
1. Conclusion First — What Must Be Decided Before the Methodology Is Final Is the Metering Boundary
The manufacturing-stage electricity contribution to a cell’s carbon footprint varies by up to about 27% from the metered value through the choice of allocation method alone, and this spread will not shrink when the methodology delegated act is finalised unless the plant’s metering structure changes. The delay in adopting the methodology should therefore be read not as a waiting period but as the period in which to design metering boundaries.
Situation (S): Article 7 requires the carbon footprint declaration[1] to be drawn up “for each battery model per manufacturing plant”. Complication (C): Yet for the delegated act[2] defining the calculation methodology, the draft for electric vehicle batteries was published on 30 April 2024 and the consultation closed on 28 May 2024 (127 responses), and it had not progressed to the adoption stage as of the 23 September 2026 check. Question (Q): When one plant makes several models, how much does line energy metering resolution affect per-cell values and batch-level allocation[3]? Answer (A): The spread between allocation methods is larger than the spread between batches, and the only means of reducing it is sub-metering[4] at process and model boundaries.
2. Mechanism — Where and by What Is Plant Electricity Consumed
The assumed plant produces model A (100 Ah, 3.2 V, 0.32 kWh, 15,000,000 cells/year) and model B (50 Ah, 3.2 V, 0.16 kWh, 20,000,000 cells/year), for a total of 8 GWh/year. Annual electricity is assumed at 200,000,000 kWh. Consumption by process and the “metered share of A” serve as the true values obtained if meters existed at process and model boundaries.
| Process zone | Annual electricity (kWh, assumed) | Share | Main consumption driver | Metered share of A (assumed) |
|---|---|---|---|---|
| Electrode (coating, drying, solvent recovery) | 70,000,000 | 35% | Coated area (proportional to capacity) | 60% |
| Dry room[5] (dehumidification, HVAC) | 50,000,000 | 25% | Exposed volume, door openings, ambient humidity | 55% |
| Assembly | 16,000,000 | 8% | Cell count | 45% |
| Formation[6] and aging | 40,000,000 | 20% | Charge/discharge protocol, dwell time (s) | 70% |
| Shared utilities | 24,000,000 | 12% | Compressed air, cooling water, lighting | 55% |
| Total | 200,000,000 | 100% | — | 58.95% |
The key point of Table 1 is that each process has a different consumption driver. Electrode scales with capacity, assembly with cell count and formation with protocol dwell time, so a single allocation key over-allocates in some processes and under-allocates in others. The draft delegated act published in 2024 likewise prioritises subdivision for multi-functional processes and, where that is not possible, requires allocation by the physical relationship that best represents the driver of the input, with documented justification (this is a draft and may change in the adopted text).
3. Calculation — Spread of Per-Cell Values by Allocation Method
| Allocation method | A allocation share | A electricity per cell | Deviation vs metered (A) | B electricity per cell | Deviation vs metered (B) | kgCO2e/kWh (capacity) A / B |
|---|---|---|---|---|---|---|
| Floor area | 65% | 8.667 kWh | +10.3% | 3.500 kWh | −14.7% | 10.83 / 8.75 |
| Operating time | 52% | 6.933 kWh | −11.8% | 4.800 kWh | +16.9% | 8.67 / 12.00 |
| Production capacity (kWh) | 60% | 8.000 kWh | +1.8% | 4.000 kWh | −2.6% | 10.00 / 10.00 |
| Cell count | 42.9% | 5.714 kWh | −27.3% | 5.714 kWh | +39.2% | 7.14 / 14.29 |
| Process metering (baseline) | 58.95% | 7.860 kWh | — | 4.105 kWh | — | 9.83 / 10.26 |
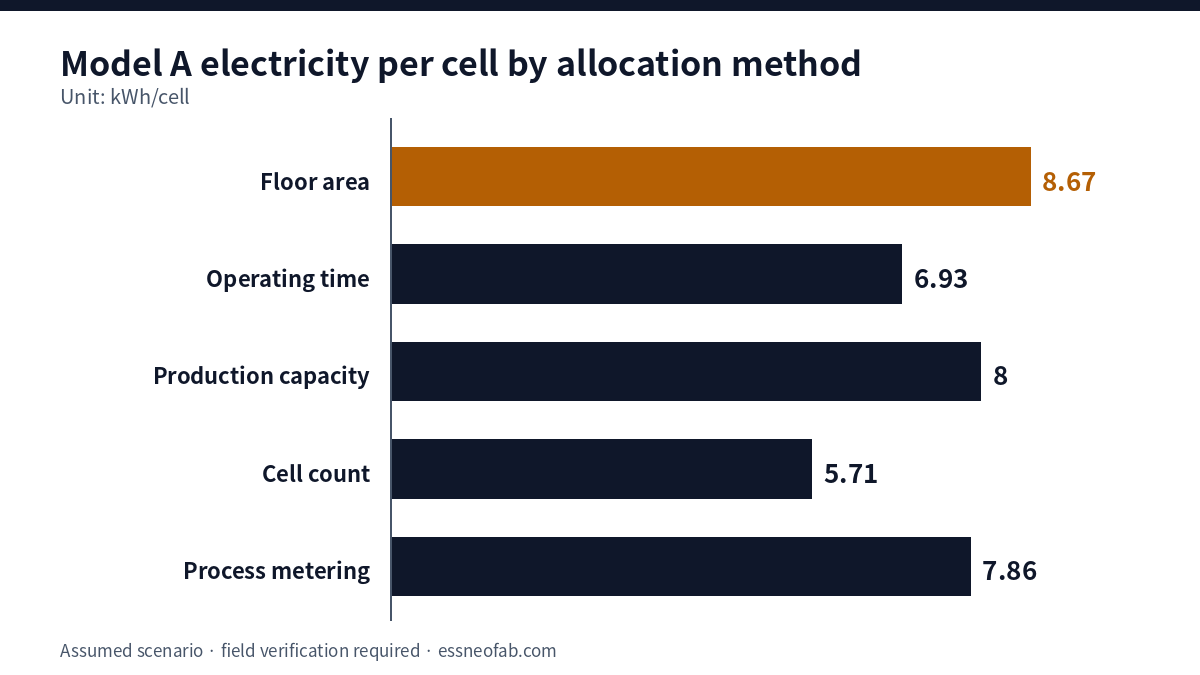
In Table 2, on a metered basis model B’s per-capacity value (10.26) is higher than A’s (9.83). Allocated by floor area, however, A becomes 10.83 and B 8.75, and the ranking of the two models is reversed. Where declarations are required per model, this reversal can steer product-portfolio decisions in the opposite direction.
Capacity-based allocation has the smallest total error at A +1.8% and B −2.6%. But because both models’ per-capacity values become equal at 10.00, an improvement applied to only one model, such as shortening its formation protocol, does not appear in the declared value. An allocation key with small error is not necessarily a good key; whether it preserves the improvement signal is a separate criterion.
Batch-level variation was also calculated. Assuming dry-room load varies ±30% around the annual average with ambient conditions, model A’s per-cell dry-room electricity of 1.833 kWh swings by ±0.55 kWh, or ±7.0% of total per-cell electricity (B: ±8.2%). This variation is invisible under annual-average allocation, but it is smaller than the spread between allocation methods (A: −27.3% to +10.3%).
4. Regulatory Status and Application Limits
| Item | Electric vehicle batteries | Rechargeable industrial batteries (above 2 kWh, excluding those with exclusively external storage) |
|---|---|---|
| Deadline to adopt methodology delegated act (Regulation text) | 2024-02-18 | 2025-02-18 |
| Carbon footprint declaration applies from | 2025-02-18 or 12 months after entry into force of the delegated/implementing act, whichever is later | 2026-02-18 or 18 months after entry into force, whichever is later |
| Performance class labelling applies from | 2026-08-18 or 18 months after entry into force, whichever is later | 2027-08-18 or 18 months after entry into force, whichever is later |
| Status (checked 2026-09-23) | Draft published 2024-04-30, consultation closed 2024-05-28 (127 responses). Adoption stage still not started, with planned period shown as “Q3 2025”. Declaration-format implementing act also at draft stage | JRC methodological support report published 2025-05-28. Adoption of the delegated act not confirmed |
Because of the “whichever is later” clauses in Table 3, the application date of the declaration obligation is also deferred as long as the methodology delegated act is not adopted. ESS batteries are often interpreted as falling within the industrial battery category, but the classification of an individual product requires separate review. The application limits are as follows.
- Electricity modelling: The draft set the national average electricity consumption mix as the default. In that case the emission factor creates almost no difference between plants, and differences in kWh per cell translate directly into differences in carbon values. The rule in the adopted text requires confirmation.
- Process gas and heat: This calculation covers electricity only. Plants using fuel for drying or solvent recovery need separate allocation.
- Formation dwell time: The 70% A share in the formation zone assumes a difference in protocol dwell time. This differs in nature from the “dwell time → channel count” equipment sizing covered in Cell Assembly FAT and Formation Channel Sizing, and shows that the same dwell time also acts as an energy allocation key.
5. Conclusions and Implications
The most valuable preparation a plant can make while the methodology delegated act remains unadopted is sub-metering at process-zone × model boundaries. In the assumed scenario the spread between allocation methods is −27.3% to +10.3%, larger than the seasonal batch variation of ±7.0%. The order of metering investment should therefore put “spatial resolution (process × model)” before “time resolution (batch)”.
Batch-level electricity metering has not been confirmed as a mandatory requirement for the model-and-plant-level declaration required by the Regulation text. However, if batch-level electricity history is linked to cell traceability, it provides the basis for reproducing sample-batch values during verification and for demonstrating improvement effects per model. The actual gap between metered values and allocation keys differs by plant, so further verification is required.
FAQ
Q. Isn’t it premature to invest in metering now, when the methodology is not yet final?
A. Whatever allocation rule the methodology adopts, applying it requires consumption by process. Even in the draft’s hierarchy (subdivision → physical relationship), subdivision comes first, and subdivision means sub-metering. The risk of having to use defaults and estimates for lack of metered data is greater than the risk of the allocation key changing.
Q. Can’t spaces shared by two models, such as the dry room, simply not be split by metering anyway?
A. Shared zones that are not physically separated cannot be split by metering alone. In that case, use a driver-based key such as exposed volume × dwell time (s), and derive that key directly from cell history (input and output times) so that the basis of the estimate is documented. The larger the share of shared zones, the greater the uncertainty of the result, so a sensitivity analysis should be presented alongside.
Field Application Notes
The items below can be executed first thing on Monday morning.
| Check | How to execute | Remarks |
|---|---|---|
| ☐ Review meter single-line diagram | Mark existing meter locations on the single-line diagram from incoming supply to process zones and record whether each of the five zones in Table 1 can be metered | The share (%) of unmeterable zones equals estimate dependence |
| ☐ Confirm current allocation key | Check which key (area, time, capacity, cell count) splits shared electricity in carbon and cost reporting | Per Table 2, A swings −27.3% to +10.3% depending on key |
| ☐ Model ranking reversal test | Apply two or more allocation keys to plant data and check whether the per-capacity ranking between models changes | If it changes, the allocation key is driving decisions |
| ☐ Prioritise formation and dry-room metering | Request quotes for zone meters in formation (large model-driver difference) and the dry room (large shared share) | Synchronise electricity data timestamps with MES time for batch linkage |
| ☐ Monitor regulatory progress | Periodically check the initiative stage on the EU “Have your say” portal | On adoption, compare electricity-modelling and allocation rules with the draft |
Footnotes
[1] Carbon footprint declaration: A document stating the life-cycle carbon footprint calculated per battery model per manufacturing plant, based on Article 7 of Regulation 2023/1542.
[2] Delegated act: A legal act adopted by the European Commission under delegation from a basic regulation to supplement non-essential details.
[3] Allocation: The procedure of attributing inputs and emissions shared by multiple products to each product according to a defined criterion.
[4] Sub-metering: Adding process-, zone- or equipment-level meters below the utility meter to measure consumption directly.
[5] Dry room: A zone that maintains low-dew-point air for moisture-sensitive processes, with large dehumidification and HVAC loads.
[6] Formation: The process of applying initial charge and discharge to assembled cells to make them shippable; from a line perspective, a long-dwell segment.
Sources: Regulation (EU) 2023/1542 concerning batteries and waste batteries, EUR-Lex, 2023-07-12, https://eur-lex.europa.eu/eli/reg/2023/1542/oj ; European Commission, “Carbon footprint methodology for electric vehicle batteries”, Have your say (initiative 13877, checked 2026-09-23), https://ec.europa.eu/info/law/better-regulation/have-your-say/initiatives/13877-Batteries-for-electric-vehicles-carbon-footprint-methodology_en ; European Commission, “Format of the carbon footprint declaration for batteries”, Have your say (initiative 13878, checked 2026-09-23), https://ec.europa.eu/info/law/better-regulation/have-your-say/initiatives/13878-Batteries-format-of-carbon-footprint-declaration_en ; European Commission, Draft Delegated Regulation Ares(2024)3131389, 2024-04-30, https://eur-lex.europa.eu/legal-content/EN/TXT/HTML/?uri=PI_COM:Ares(2024)3131389 ; Joint Research Centre, “Calculating the carbon footprint of industrial batteries: a methodological support”, 2025-05-28, https://joint-research-centre.ec.europa.eu/jrc-news-and-updates/calculating-carbon-footprint-industrial-batteries-methodological-support-2025-05-28_en
Measurement & Calculation Conditions: Capacity 8 GWh/year (model A 100 Ah, 3.2 V, 15,000,000 cells; model B 50 Ah, 3.2 V, 20,000,000 cells); annual electricity 200,000,000 kWh; consumption and metered A share by process zone; area share 65%; operating-time share 52%; emission factor 0.40 kgCO2e/kWh; and dry-room load variation ±30% are all assumed values. Fuels and process gases other than electricity, and conversion to the functional unit based on energy delivered over service life, are not included. Regulatory status is as checked on the official portal on 2026-09-23; results vary with actual plant conditions, so field verification is required.


You May Also Like
Hanwha Energy Sells Two Large Italian BESS Projects to Sweden’s OX2 — Evidence of European Development Capability

From EV to ESS Use: What Ultium Cells and Cosmos Lab Show About Converting a Line’s Purpose