Cells shipped on time, yet LGES ESS revenue hit only 94 % of plan
ESS NEOFAB WEEKLY · No.09 · Process
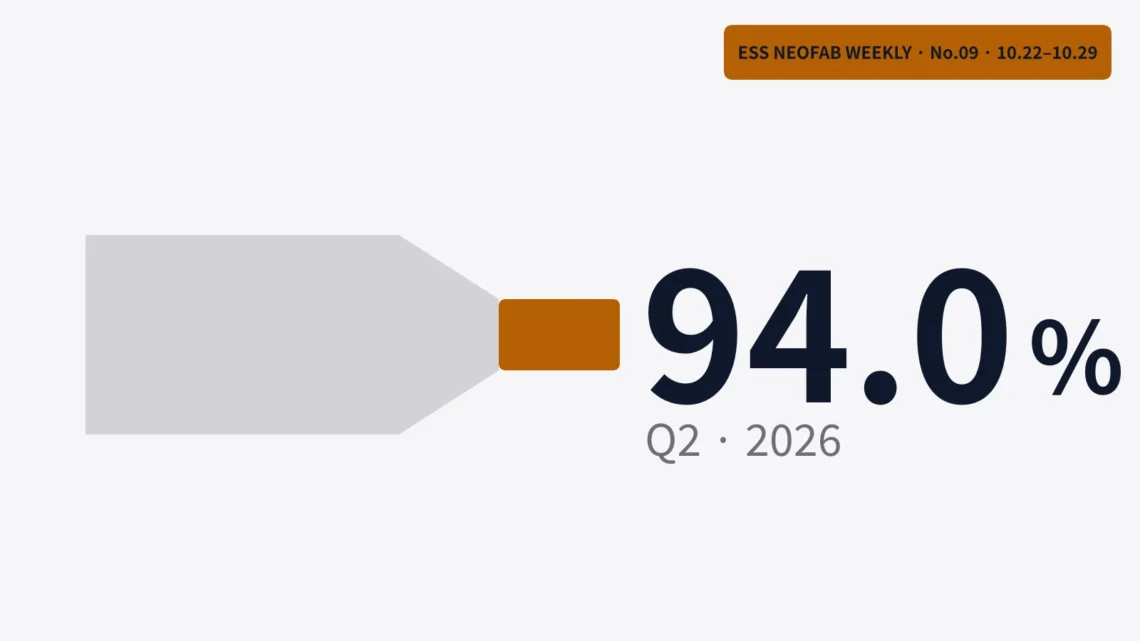
The cells came out on time, but packs and containers lagged, so Q2 ESS revenue reached only 94 % of plan.
Summary
In the second quarter of 2026, LG Energy Solution’s North American storage business made cells without trouble, yet pack and container capacity became the bottleneck, and broker figures put ESS revenue growth at +31.6 % against company guidance of +40 %. That is 94.0 % of plan, and the missing 6.0 % equals roughly 5.5 days of shipments out of a 91-day quarter. My calculation shows that clearing this backlog in Q3 on top of the plan would take +55.4 % quarter on quarter, and a broker analysis reported on 27 October puts Q3 ESS revenue growth at close to 60 %. Taken together, the two quarters land within ±2 % of the plan path, and the +40 % Q3 plan rate is my own assumption.
Cells kept pace while packs and containers fell behind
On 27 October 2026, the Korean daily Global Economic reviewed third-quarter results at Korea’s three big battery makers. Its section on LG Energy Solution carried an analysis by Shinyoung Securities[1]. According to that analysis, the bottleneck in North American ESS1 pack production had eased. ESS revenue rose by close to 60 % from the previous quarter, and the North American ESS lines reached a utilisation rate of about 90 %.
The company itself published preliminary results2 on 8 October. Revenue was KRW 9.6434 trillion and operating profit was KRW 756.0 billion. That release gave no figures by business unit. Every ESS-specific number in this story comes from brokers.
The bottleneck story started three months earlier. On 31 July, a report from IBK Securities said Q2 ESS revenue grew 31.6 %, short of the +40 % guidance[2]. It explained the miss in one line. Cell3 production ran smoothly, but pack4 and container5 capacity acted as the bottleneck6. In the same month, Samsung Securities pointed to production limits at the outside suppliers that build modules and packs[3].
I lined these reports up by date and ran the numbers. Q2 came in at 94.0 % of plan. To ship the Q2 shortfall plus the Q3 plan, revenue had to rise 55.4 % quarter on quarter. Brokers reported growth of close to 50 % in shipments and close to 60 % in revenue. My figure sits between the two.
That gap raises one question I want to answer here. If the cell plant ran fine, why did fewer finished systems leave the company than planned? A cell line’s own scorecard cannot answer it. You need to look at the whole chain, from cell to container shipment, as one line.
The slowest step sets the pace for everyone
Think of a home with a washer and a dryer. Your washer finishes a load every hour. Your dryer needs an hour and ten minutes per load. By evening, the number of dry clothes depends on the dryer alone, and the faster washer only fills the basket of wet laundry.
An ESS factory works the same way. Cells come off the cell line. Module and pack steps group them. The container step puts packs, cooling and fire protection into one box and ships it. Revenue counts only that last box. Cells sitting in a warehouse are not revenue yet.
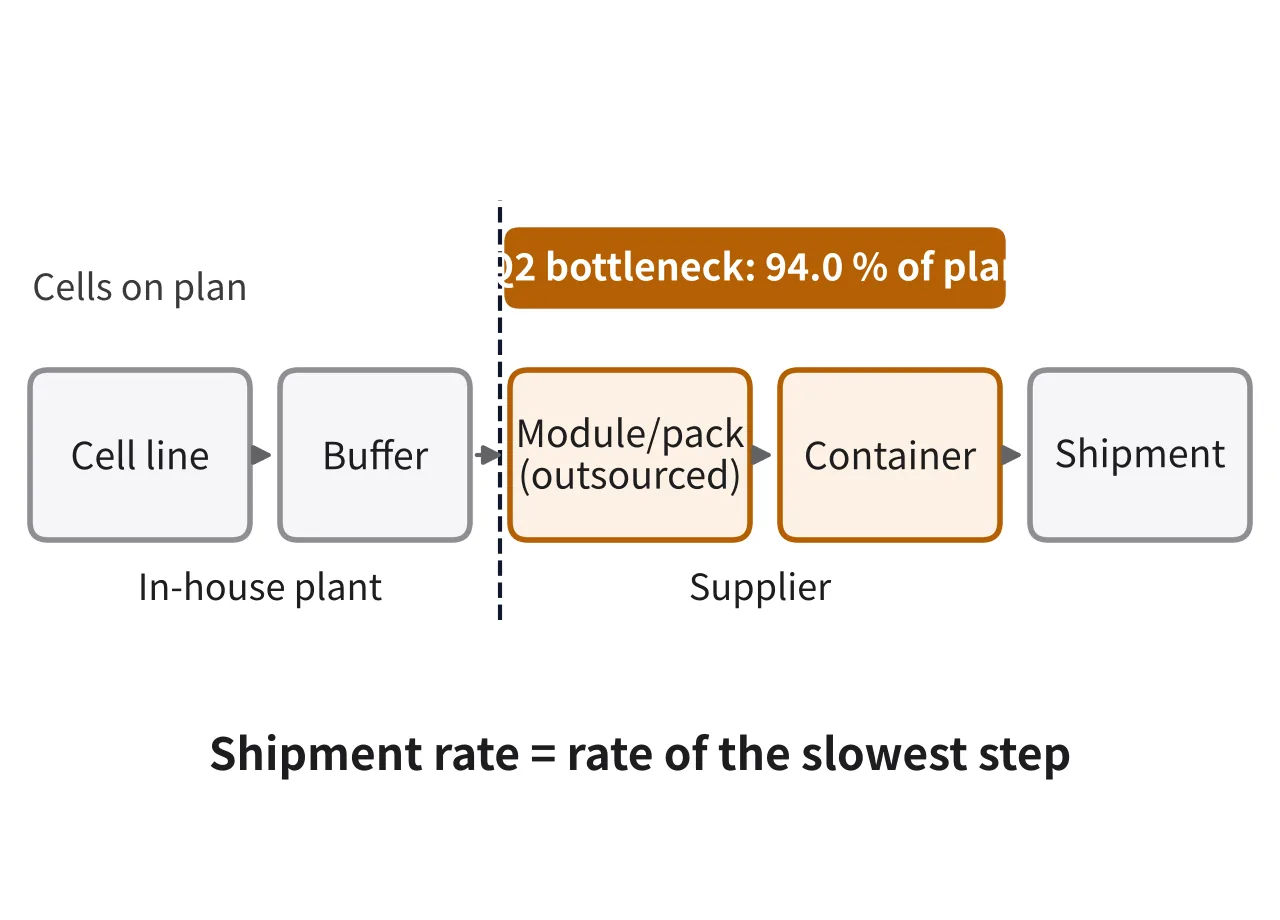
The diagram splits the path from cell to shipment into steps and marks where Q2 got stuck. Reports place a company boundary between the cell line and the outsourced pack work. Matching capacity across steps is called line balancing7. In this case the balance broke at an interface8 between two companies.
The laundry picture fails in one place. Wet clothes can wait in a basket for a day. Cells need floor space and tracking records while they wait, and contracted delivery dates keep passing. If the cell line keeps running, the buffer9 between cells and packs grows. Once it fills, the cell line has to slow down. None of the reports says which of these happened.
Production planners give these two states separate names. A step that stops because the next step will not take its output is blocked. A step that idles because the previous step sends nothing is starved. In Q2 the cell line was probably closer to blocked. In Q3 the pack step likely had a pile of waiting cells, so it rarely starved.
The bottleneck therefore leaves two kinds of cost. One is the stock of waiting cells, which can turn into shipments once the pack step speeds up. The other is idle time on the cell line. Lost hours never come back, because time cannot sit in a warehouse.
Recovering the missing 6 % took 55 % growth
I converted the backlog into revenue to see how heavy it was for Q3. IBK’s table lists ESS revenue of KRW 1.6730 trillion in Q1 and KRW 2.2010 trillion in Q2[2]. Applying the +40 % guidance to Q1 gives a Q2 plan of KRW 2.3422 trillion. Actual revenue fell KRW 141.2 billion short.
That shortfall is 6.0 % of plan. Q2 had 91 days, or 7,862,400 s. At the planned pace, about 474,000 s (about 5.5 days) of output stayed in the warehouse or on the line. This treats revenue as volume, so it assumes prices and product mix did not change between quarters.
If the Q3 plan also assumed +40 %, it would be KRW 3.2791 trillion. Adding the KRW 141.2 billion backlog gives KRW 3.4203 trillion. Reaching that from the Q2 actual requires 55.4 % growth. Two broker estimates, close to 50 % for shipments and close to 60 % for revenue, bracket that value[1][4].
Neofab’s calculation note
Q2 plan = KRW 1.6730 trillion × 1.40 = KRW 2.3422 trillion
Q2 attainment = 2.2010 ÷ 2.3422 = 94.0 %, shortfall KRW 141.2 billion (6.0 %)
Shortfall in time = 0.060 × 7,862,400 s = about 474,000 s (about 5.5 days)
Q3 plan = KRW 2.3422 trillion × 1.40 = KRW 3.2791 trillion
Q3 revenue needed to catch up = 3.2791 + 0.1412 = KRW 3.4203 trillion
Required growth = 3.4203 ÷ 2.2010 − 1 = 55.4 %
Assumptions: Q3 plan growth of +40 % (the Q2 guidance carried forward), revenue proportional to volume (constant price, mix and exchange rate), and the full Q2 shortfall rolling into Q3. ESS revenue comes from a broker table, because the company does not disclose it separately.
Adding the two quarters together shows more about the bottleneck. With 50 % growth in Q3, the two-quarter total falls 2.1 % short of the plan path. With 55 % it falls 0.2 % short, and with 60 % it comes out 1.8 % ahead. Whichever estimate you pick, the total stays within ±2 % of plan.
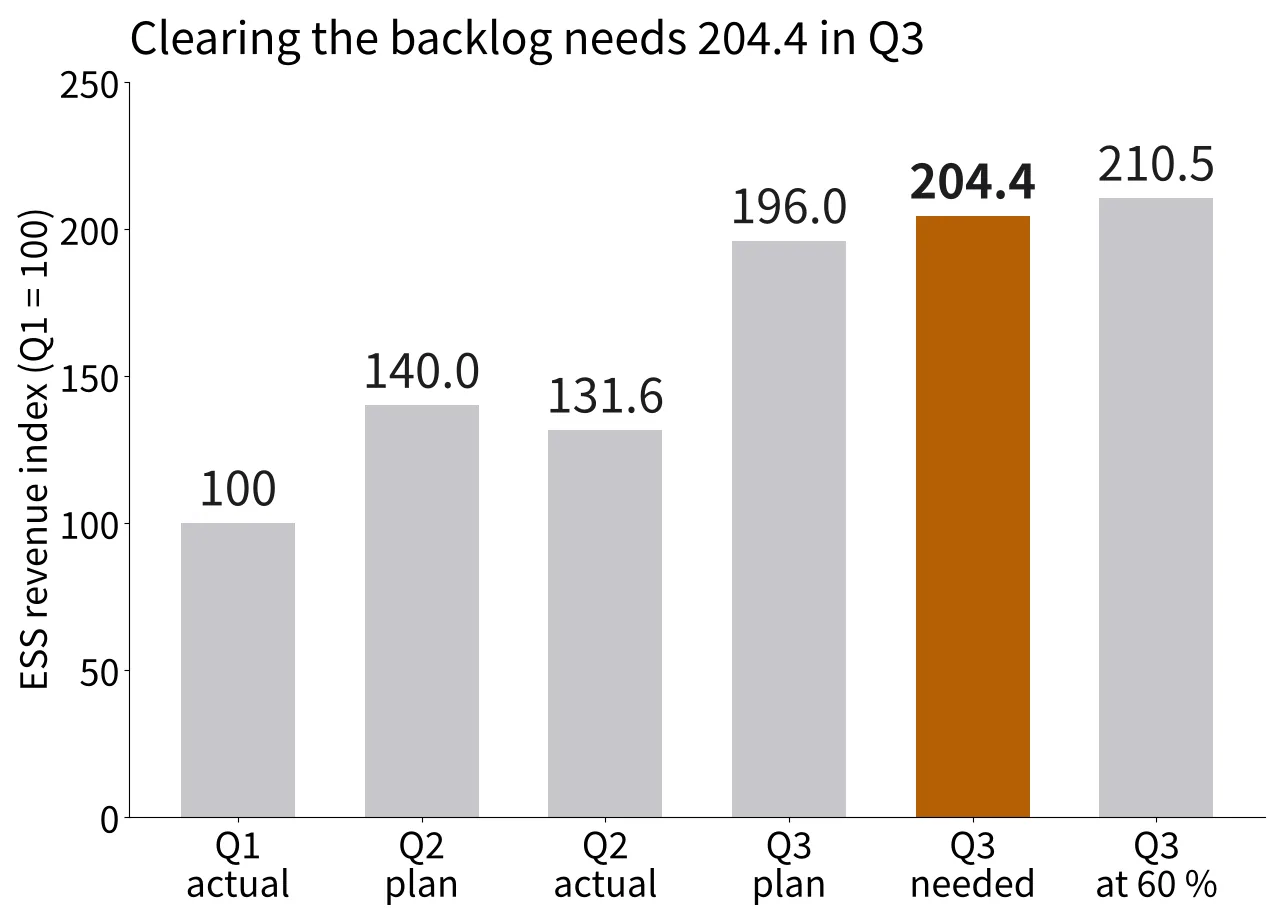
With Q1 set to 100, Q2 shows a plan of 140.0 and an actual of 131.6. Q3 shows a plan of 196.0, a catch-up need of 204.4, and 210.5 at 60 % growth. Side by side, the Q2 gap and the Q3 overshoot look similar in size. At 60 %, Q3 beats the plan path by KRW 242.5 billion, which covers the KRW 141.2 billion backlog with KRW 101.3 billion to spare.
I also checked the July forecast. IBK then expected Q3 ESS revenue of KRW 3.1230 trillion, or +41.9 %[2]. My catch-up figure of KRW 3.4203 trillion is 9.5 % above that forecast. If you accept the October estimate of close to 60 %, the gap widens to 12.8 %. July’s forecast did not picture the backlog clearing all at once in Q3.
What the broker reports state, and what they leave out
Every step above rests on broker estimates. LG Energy Solution disclosed only group revenue and operating profit for Q3. ESS revenue and shipments come from analysts. Table 1 sorts each number by who published it and when.
| Figure | Value | Source and date |
|---|---|---|
| Q2 ESS revenue growth | +31.6 % (guidance +40 %) | IBK Securities, 31 July |
| Where the bottleneck sat | Pack and container capacity (cells on plan) | IBK Securities, 31 July |
| Cause of the bottleneck | Output at outsourced module and pack makers | Samsung Securities (via BizWatch), 7 July |
| Q3 ESS shipments | Up close to 50 % quarter on quarter | DS Investment & Securities (via BusinessPost), 12 October |
| Q3 ESS revenue and utilisation | Up close to 60 %, North American ESS lines near 90 % | Shinyoung Securities (via Global Economic), 27 October |
Shipment growth and revenue growth differ by about 10 points. If revenue grew faster than shipments, prices may have risen or pricier products may have taken a larger share. Or the two brokers may have measured on different bases. Nothing I found settles which.
The 90 % utilisation figure is hard to read on its own. Korea Financial Newspaper reported average utilisation across all company plants of 47.6 % in 2025 and 52.8 % in the first half of 2026[5]. That average includes EV lines. Shinyoung’s 90 % covers North American ESS lines only, so the denominator differs, and the counting method is not public.
News reports usually use utilisation10 to mean actual output divided by capacity. OEE11 counts differently. OEE = Availability × Performance × Quality. If 90 % meant availability only, and you assume performance of 94 % and quality of 97 %, OEE drops to 82.1 %. One and the same 90 % can describe line performance that differs by nearly 8 points, depending on what it divides.
Capacity figures also come from a single place. IBK put the company’s US ESS capacity at 57 GWh, split across five sites including Holland at 17 GWh and Lansing at 10 GWh[2]. LG Energy Solution has said it aims for more than 50 GWh of North American LFP capacity for ESS by year end[5]. None of these sources gives pack or container capacity in GWh. So I could not measure the bottleneck from capacity directly, and I measured it backwards from the revenue gap.
The bottleneck delayed volume more than it erased it
The cell plant ran fine, yet shipments fell short, because the slowest step in the line was packs and containers. In Q2 that step handled 94.0 % of plan. In Q3, brokers estimate, it sped up enough to clear the backlog. Over two quarters, the total sits within ±2 % of the plan path, which suggests the bottleneck pushed volume back by a quarter rather than wiping it out.
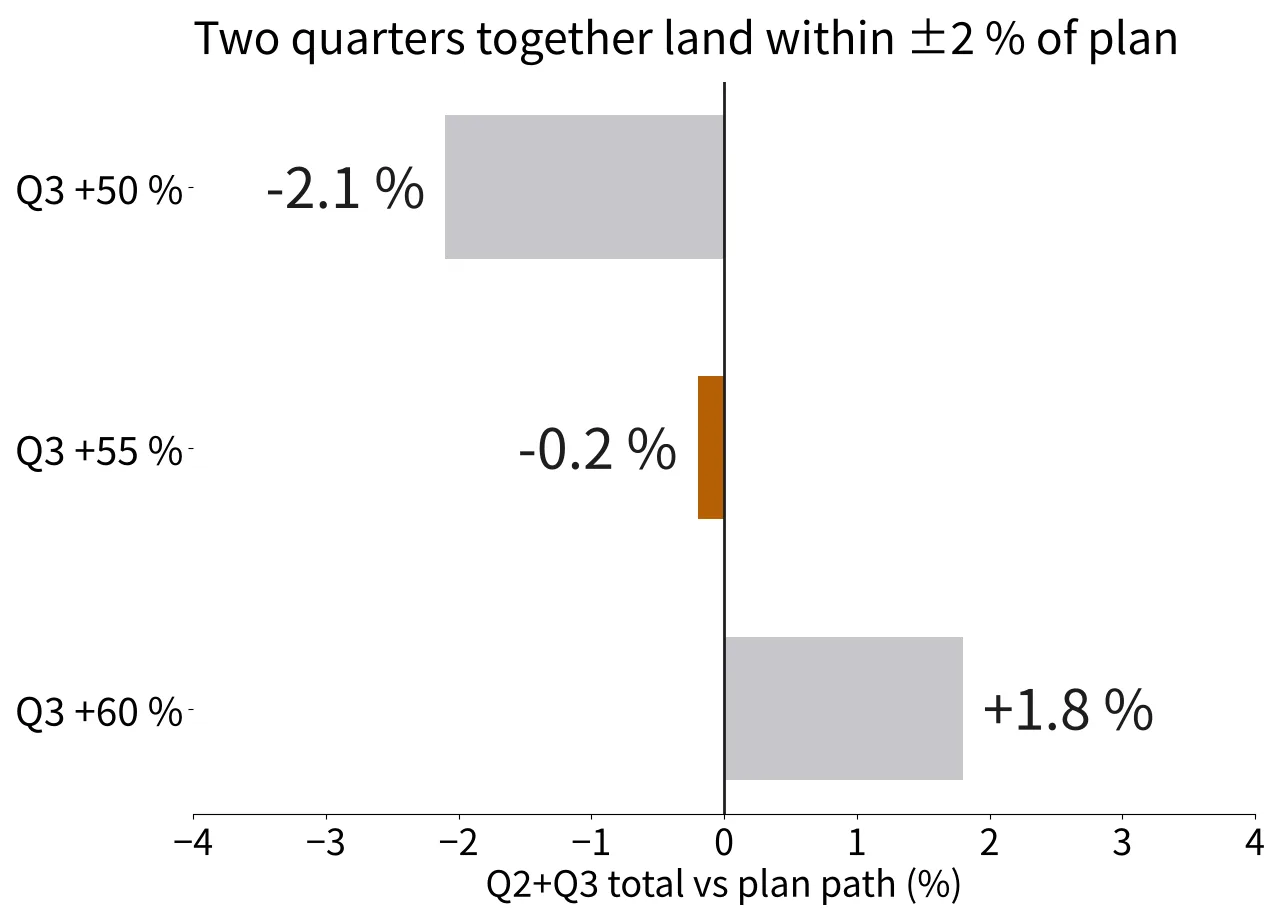
The three pairs in the chart compare the two-quarter total with the plan path at Q3 growth of 50 %, 55 % and 60 %. Differences run from −2.1 % to +1.8 %. The bars barely differ in length. Look at Q2 alone and the shortfall was 6.0 %.
So I judge that the Q3 growth of close to 60 % should not be read as a pace that carries into Q4. It stacks the KRW 141.2 billion backlog on top of what would have been +40 % under plan. Once the catch-up quarter ends, growth should drift back toward the planned pace.
My second judgment concerns how to read ESS expansion news. Check whether pack and container capacity matches the cell plant’s GWh before you look at the cell figure itself. Q2 showed that shipments can stall at 94 % even with plenty of cells. In Q2 the stuck step sat at an outside supplier, and a supplier’s plant never shows up in the cell plant’s GWh number.
The limits of this reasoning matter too. My +40 % Q3 plan rate is an assumption, carried over from Q2 guidance. Treating revenue as volume breaks down if prices or exchange rates move. The 60 % from Shinyoung and the 50 % from DS both come with the word “close to”. They are approximations. Do not trust them to the decimal.
DS Investment & Securities expects the remaining bottleneck to clear during Q4[4]. Next I will look for one number: whether the company breaks out ESS revenue in its Q3 results presentation, and whether that figure lands above or below KRW 3.4203 trillion.
Frequently asked questions
If the North American ESS lines run at 90 % utilisation, is OEE also 90 %?
Not necessarily. OEE = Availability × Performance × Quality, and nobody has said which of these the reported 90 % represents. If it is output over capacity, it may already include performance and quality losses. If it is availability alone, OEE comes to 82.1 % with performance at 94 % and quality at 97 %. Until the method is public, keep it apart from the 52.8 % company average as well.
Wouldn’t building more cell plants remove this kind of bottleneck?
Reports put the Q2 bottleneck in packs and containers. Adding cell capacity in that situation only grows the pile of waiting cells. Shipments stay tied to the pace of the pack step. If pack throughput rises from 94 % to 100 % while the 57 GWh of US ESS capacity stays the same, shipments grow by 6.4 %.
What each reader can do
Here is how the KRW 141.2 billion backlog and the 55.4 % growth figure work from different seats.
| Reader | What to take away | What to try now |
|---|---|---|
| Job seeker | Smooth cell output still ships only 94 % if the pack and container steps handle 94 % of plan | Search production-control and process-engineering postings for “bottleneck”, “line balancing” and “supplier management” appearing together |
| General reader | The close-to-60 % ESS revenue jump includes about 5.5 days of Q2 output that shipped late | In next quarter’s ESS coverage, check whether growth returns to around 40 % |
| Reader interested in investing | ESS unit revenue and the 90 % utilisation figure are broker estimates, not company disclosures | Find ESS revenue in the company’s results material, compare it with KRW 3.4203 trillion, and note whether pack and container capacity appears in GWh |
This article is for information only and is not investment advice. See our Disclaimer.
Glossary
- ESS (Energy Storage System) — Equipment that stores electricity and releases it when needed. Here it means the business of shipping cells, packs and containers as one system. ↩
- Preliminary results — Quarterly revenue and operating profit that a company announces before closing its books. They usually omit figures by business unit. ↩
- Cell — The smallest unit of a battery that stores electricity. A cell line is the group of processes that makes it. ↩
- Pack — Several cells grouped into modules, with wiring and control devices attached. Here it means the step after cells. ↩
- Container (container BESS) — The shipping unit that holds packs plus cooling and fire protection in a box the size of a freight container. It is the form that becomes revenue. ↩
- Bottleneck — The step with the lowest capacity in a line, which sets total output. Reports put packs and containers in that position in Q2. ↩
- Line balancing — Matching capacity and workload across steps so the whole line ships at one pace. ↩
- Interface — The point where two steps, or two companies, hand over goods and information. Here it is the link between the cell plant and the outsourced pack maker. ↩
- Buffer — Work in progress stored between steps. It grows when the next step is slow and stops the previous step when full. ↩
- Utilisation (capacity utilisation) — In news reports, usually actual output divided by capacity. Methods vary between companies and brokers, so it is not the same as OEE. ↩
- OEE (Overall Equipment Effectiveness) — The share of possible output that a machine actually turns into good product. OEE = Availability × Performance × Quality. More: How to calculate OEE ↩
Sources and notes
- Global Economic (Korean), “ESS split Q3 for K-battery makers: LGES and Samsung SDI on course, SK On struggling”, 2026-10-27. Q3 preliminary revenue of KRW 9.6434 trillion and operating profit of KRW 756.0 billion; Shinyoung Securities analysis (North American ESS pack bottleneck eased, ESS revenue up close to 60 % quarter on quarter, North American ESS line utilisation near 90 %). https://www.g-enews.com/article/Industry/2026/10/202610271358224729139bf6e4b2_1
- IBK Securities, company report on LG Energy Solution, “Q2 2026: ESS weaker than expected” (Korean), 2026-07-31. ESS revenue of KRW 1.6730 trillion in Q1 and KRW 2.2010 trillion in Q2 (+31.6 %, guidance +40 %), Q3 forecast of KRW 3.1230 trillion, pack and container capacity bottleneck, US ESS capacity of 57 GWh. https://m.ibks.com/iko/IKO01/download.do?seq=12375
- BizWatch (Korean), “LGES aimed for profit without subsidies, but…”, 2026-07-07. Samsung Securities analysis of production limits at outsourced module and pack makers; plan for more than 50 GWh of North American ESS capacity by year end. https://news.bizwatch.co.kr/article/industry/2026/07/07/0017
- BusinessPost (Korean), “LGES ‘bottleneck eased’, Samsung SDI ‘US output up’: ESS hopes for large battery stocks continue into Q4”, 2026-10-12. DS Investment & Securities view that Q3 ESS shipments rose close to 50 % quarter on quarter and the remaining bottleneck clears in Q4. https://www.businesspost.co.kr/BP?command=article_view&num=449098
- Korea Financial Newspaper (Korean), “LGES starts its Lansing plant for ESS and EV production”, 2026-08-19. Average plant utilisation (47.6 % in 2025, 52.8 % in H1 2026) and the target of more than 50 GWh of North American LFP capacity for ESS. https://www.fntimes.com/html/view.php?ud=2026081910463360467492587736_18
- Assumptions: the Q3 plan growth rate carries over the Q2 guidance of +40 %. Revenue is treated as proportional to volume, with price, product mix and exchange rate held constant between quarters, and the full Q2 shortfall rolls into Q3. The 94 % performance and 97 % quality in the OEE example are also assumed for illustration.
- Method: Q2 plan = Q1 ESS revenue × 1.40; attainment = Q2 actual ÷ plan; time equivalent = shortfall share × 91 days (7,862,400 s); required growth = (Q3 plan + Q2 shortfall) ÷ Q2 actual − 1. The two-quarter comparison repeats the calculation with Q3 growth of 50 %, 55 % and 60 %. The company does not disclose ESS unit revenue separately, so the broker report figures stand in for it.

You May Also Like
Designing the Merge Point in a 10 GWh Pack-Container Integration Line: Synchronizing Two Upstream Lines and Sizing AGV Fleet from the Powertrac × Sunka Lead Order
FAT and SAT Differ in More Than Location — How IEC 62381:2024 Defines the Tests