Between the Continuous Solid-Electrolyte Process and the Assembly Line: How Should the Buffer Interface Be Designed?
Abstract
CIS’s continuous-process pilot line for sulfide-based solid electrolyte at its Daegu Plant 3 (2–5 t/year, expanded from the existing batch process’s 840 kg) and M Plus’s order for six types of all-solid-state battery assembly equipment (targeting development/fabrication completion by end-2026) reveal a textbook interface problem: the production capacities of the upstream materials process and the downstream assembly process are not scaled up on the same timeline. This article estimates, as an assumed scenario, the buffer stock and takt-time loss required between these two processes, to quantitatively pin down why the materials-assembly interface design is a leading variable for the line’s overall OEE (Overall Equipment Effectiveness). The downstream assembly equipment’s target throughput and the electrolyte usage per cell used in this calculation are not confirmed in public materials and are arbitrarily assumed values; field measurement verification is essential before application to an actual line.
1. If Materials Scale-Up Is Not Designed Together with Assembly Capacity, the Gap Is Passed Down as a Buffer Problem
To state the conclusion first: when the upstream materials process (electrolyte production) converts from a batch process to a continuous process without the downstream assembly process’s target throughput being fixed at the same time, that gap will necessarily appear somewhere on the line, in the form of buffer-stock size and takt-time loss.
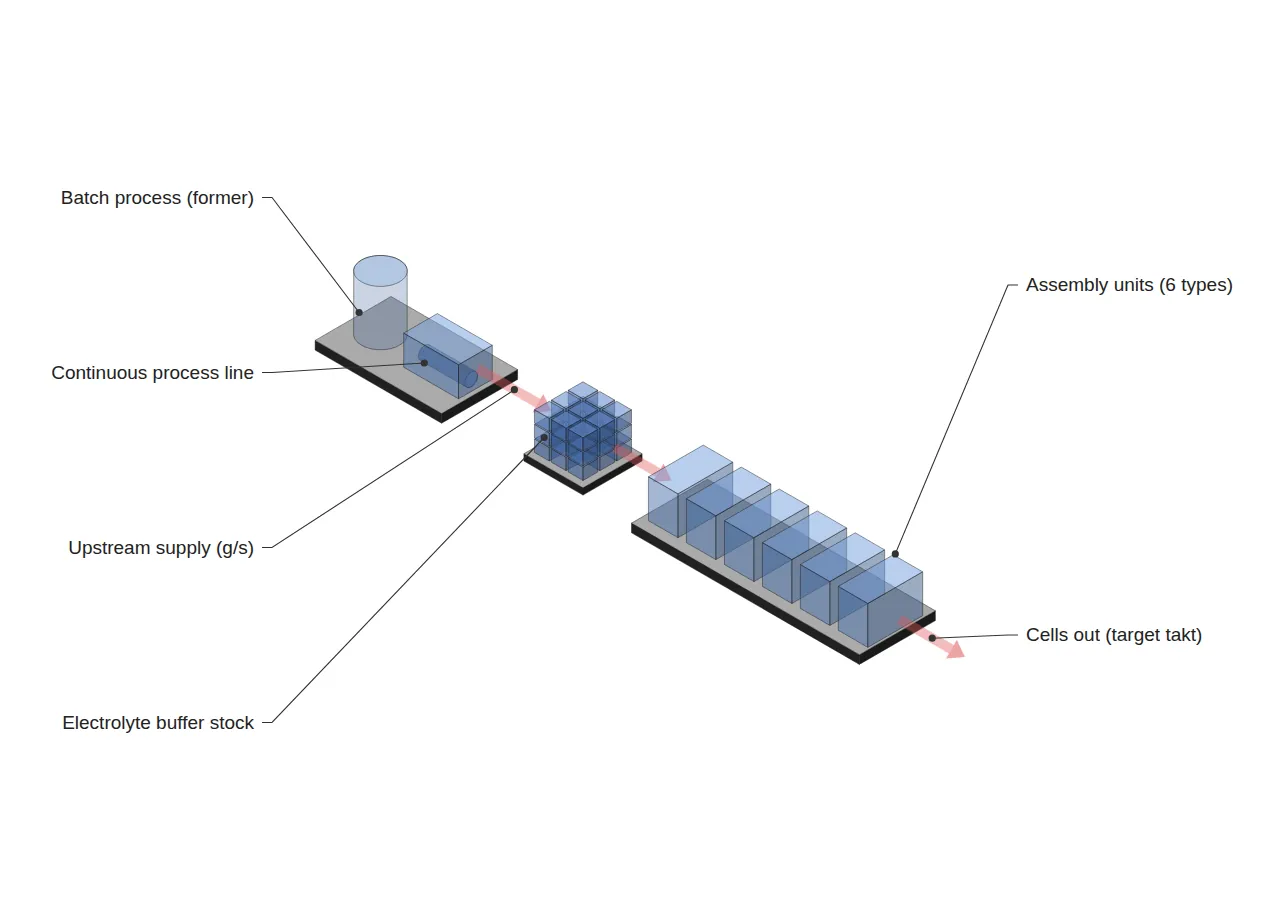
In 2026, ahead of all-solid-state battery commercialization, the battery industry is scaling up materials and assembly separately, on each side (Situation). CIS expanded its solid-electrolyte production capacity from a batch 840 kg/year to a continuous 2–5 t/year, while M Plus separately won an order for six types of all-solid-state assembly equipment, planning to complete development within the year (Complication: the two processes are proceeding under different entities and different schedules). The problem is that the instantaneous throughput rates (g/s, cells/h) of the two processes have never been disclosed (Question: what buffering design is needed when upstream and downstream speeds diverge?). This article converts the disclosed annual production-capacity figures into a per-second throughput rate, sets a downstream target as an assumed scenario, and calculates the required buffer stock and takt-time loss (Answer).
2. Data Snapshot: Status of the Materials-Assembly Interface
Below is the measured data and related patent literature underlying this analysis.
| Category | Content | Source |
|---|---|---|
| Upstream (electrolyte) | CIS Daegu Plant 3, sulfide-based solid-electrolyte continuous pilot line. Annual production capacity 2–5 t (expanded from existing batch process’s 840 kg) | Lead Economy, BatteryDive |
| Downstream (assembly) | M Plus, order for six types of all-solid-state battery assembly equipment. Targeting development/fabrication completion by end-2026 | yelec.kr |
| Process patent | US11251460B2 — Method of low-temperature-treating a precursor and then heat-treating at 500–1000 °C to form a solid-electrolyte thin film 5 nm–1000 µm thick | Google Patents |
| Process patent | US10566611B2 — Method of casting a low-melting-point electrolyte slurry and then evaporating the solvent to form a dry-powder coating | Google Patents |
| Process patent | WO2016196445A1 — Continuous, uniform nano-coating technology for cathode/anode active materials and solid electrolyte | Google Patents |
All three patent documents share a common direction: manufacturing solid electrolyte as a “continuous and uniform thin film.” This suggests that CIS’s batch-to-continuous conversion aligns with the industry’s overall technical direction, but whether the continuous upstream process’s throughput matches the downstream assembly equipment’s target takt time is a separate matter that must be verified.
3. Mechanism Analysis: The Buffer Interface Created by the Batch-to-Continuous Conversion
The calculation below is an assumed scenario. Only the items in bold are measured values confirmed in public materials; the rest are values arbitrarily set to illustrate the interface-design logic.
| Item | Value | Note |
|---|---|---|
| Batch (existing) production capacity | 840 kg/year | Measured (confirmed via news) |
| Continuous (new) production capacity range | 2,000–5,000 kg/year | Measured (confirmed via news); midpoint of 3,500 kg/year adopted for calculation |
| Operating days per year (assumed) | 300 day/year | Assumed scenario — field verification needed |
| Operating hours per day (assumed) | 20 h/day | Assumed scenario (4h maintenance excluded) — field verification needed |
| Upstream throughput (calculated) | 0.1620 g/s | 3,500,000g ÷ 300day ÷ 20h ÷ 3600s |
| Electrolyte usage per cell (assumed) | 20 g/cell | Assumed scenario (large pouch-type cell assumed) — field verification needed |
| Upstream-supportable assembly speed (calculated) | 29.17 cells/h | 0.1620 g/s × 3600 ÷ 20 g/cell |
| Downstream target assembly speed (assumed) | 45 cells/h | Assumed scenario (station target) — field verification needed |
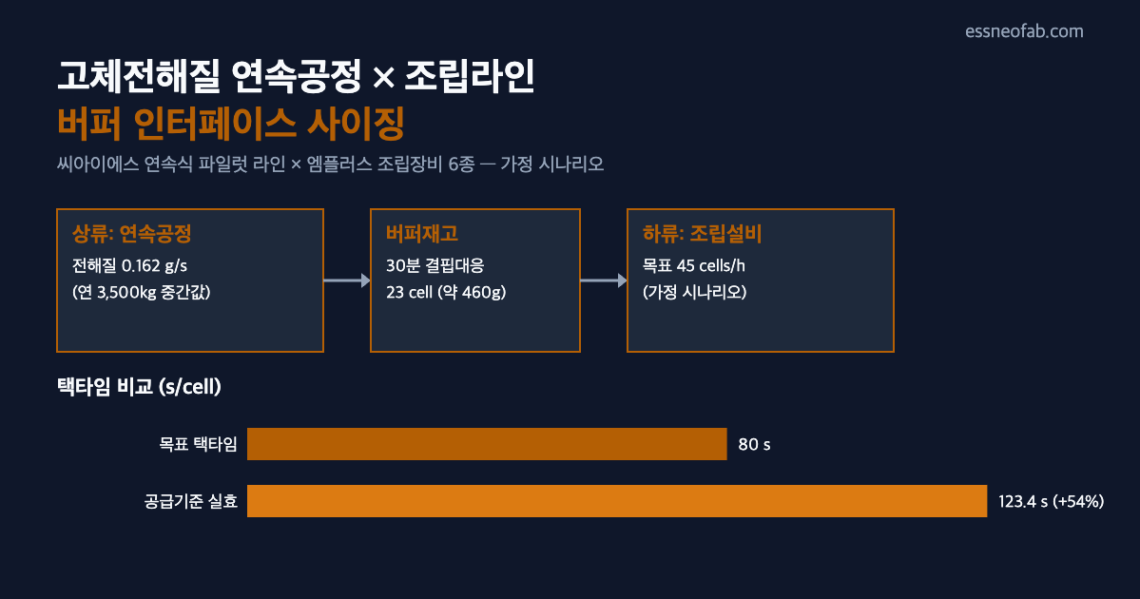
| Target takt time | 80 s/cell | 3600 ÷ 45 |
| Supply-based effective takt time | 123.4 s/cell | 3600 ÷ 29.17 |
| Takt-time loss | 43.4 s/cell (approx. 54% increase) | 123.4 − 80 |
| Buffer stock for 30-min (1,800s) shortfall coverage | 23 cells (approx. 460 g) | 1800s ÷ 80s/cell, rounded up |
The calculation shows that even if the upstream continuous process runs at full new target capacity (3,500 kg/year, midpoint), if the downstream assembly equipment targets 45 cells/h, the upstream becomes the bottleneck on a per-second throughput basis. If this gap is left unaddressed without buffer stock, the assembly equipment ends up waiting in a state of starvation, and that waiting time erodes the Availability factor of the downstream’s effective OEE. The conclusion of this assumed scenario is that to cover a 1,800 s-unit shortfall, a standing buffer stock of roughly 23 cells’ worth (460 g) of electrolyte must be maintained ahead of the assembly equipment.
What should be emphasized here is that this bottleneck does not show up from a total-volume (annual tonnage) comparison alone. The figure of 3,500 kg/year looks large, but once divided by actual operating time (in seconds), it can convert to an instantaneous throughput that falls short of the assembly equipment’s target takt time. From a line-engineering perspective, the interface buffer must be designed based on per-second/per-hour throughput, not annual production capacity.
4. Trend Snapshot
Two adjacent trends observed this week are briefly appended. Both are separate interfaces from this article’s main mechanism (materials-assembly buffer sizing), so they are cited only as a snapshot.
- High-nickel/silicon anode material mass-production trends: at the “InterBattery 2026” exhibition, Ecopro disclosed achieving 94% nickel mass production and completing 95% development, while Daejoo Electronic Materials is preparing 6th-generation silicon anode mass production (7th generation is at the R&D stage). POSCO Future M has secured silicon-anode mass-production technology and plans mass production by 2028. These material conversions are also likely to face the same interface-matching problem with future assembly capacity.
- Battery Passport: the Global Battery Alliance (GBA), under the World Economic Forum (WEF), unveiled the first battery e-passport prototype at Davos. Audi, BASF, CATL, LG Energy Solution, Tesla, and Volkswagen are participating, in a structure that tracks (traceability) full lifecycle data from raw materials through production, use, and disposal. The buffer-stock inbound/outbound data addressed in this article could also potentially be linked with such a full-lifecycle tracking system in the future.
5. Conclusion and Implications
CIS’s continuous-process conversion and M Plus’s assembly-equipment order are each reported as independent positive news, but from a line-engineering perspective, whether the instantaneous throughput rates of the two processes match is the leading variable that must first be confirmed. This article’s assumed scenario showed that if a gap exists, takt-time loss of up to approximately 54% can occur, and offsetting it requires a buffer stock of roughly 23 cells’ worth to cover a 1,800 s shortfall. However, since these figures are the result of arbitrarily assuming an undisclosed downstream target throughput and electrolyte usage per cell, field measurement verification of both figures must precede any application to an actual line design.
Metric definitions: OEE (Overall Equipment Effectiveness) = Availability × Performance × Quality; Takt Time = available operating time ÷ customer-required quantity. In this article these metrics are not used interchangeably with Cycle Time or FPY.
FAQ
Q. If the upstream production capacity of 2–5 t/year is already much larger than the downstream, isn’t a buffer unnecessary?
A. Looking at the annual total, the upstream appears larger, but what matters in interface design is the instantaneous throughput rate. A line that has only recently converted from batch to continuous may have uneven throughput during its stabilization period, and a point can occur where the instantaneous supply falls below the downstream’s target takt time during that period. Judging interface design by total-volume comparison alone misses this risk of momentary starvation — which is why this article separately converted the annual figures into per-second terms.
Field Application Notes
| Item | Check | Timing |
|---|---|---|
| Confirm measured upstream throughput | Obtain the continuous line’s actual g/s throughput via logs to replace this article’s assumed value (0.1620 g/s) | Immediately |
| Finalize downstream target takt time | Document the per-station target takt time (s/cell) for the six types of assembly equipment | This week |
| Measure electrolyte usage per cell | Obtain the measured g/cell figure via pilot-cell teardown analysis | Within 2 weeks |
| Recalculate buffer stock size | Re-verify this article’s formulas with measured values and adjust buffer rack capacity as needed | After measured values are obtained |
| Link Traceability logs | Pre-define the data items to align buffer inbound/outbound data with the Battery Passport specification | After the Battery Passport specification is finalized |
Related Reading
- Inter-Process Buffers: Bigger Isn’t Always Better
- Designing the Merge Point in a 10 GWh Pack-Container Integration Line: Synchronizing Two Upstream Lines and Sizing AGV Fleet from the Powertrac × Sunka Lead Order
- Solid Electrolyte and Aqueous Zinc Batteries: Investment Is Up — Is the Line Ready?


One Comment
Pingback: