ESS Assembly Line: Why Immersion Cooling Becomes a Bottleneck
Abstract
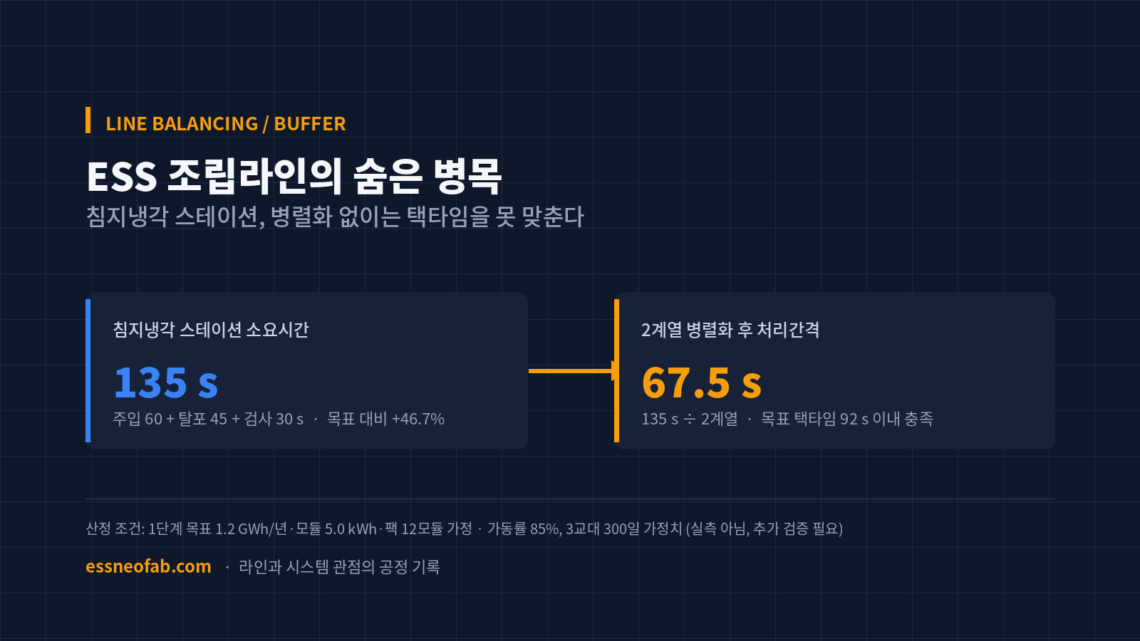
This article addresses the line-balancing problem that arises when immersion cooling and AI cell monitoring are simultaneously integrated in-line into an ESS module-pack assembly line. Under the estimation scenario, the immersion-cooling station’s process time is 135 s, exceeding the target module takt time of 92 s by 46.7%, making a bottleneck unavoidable with a single-station configuration. Parallelizing into 2 lines lowers the effective processing interval to 67.5 s, satisfying the takt-time condition, but this in turn raises the FIFO buffer size at the point where the two lines merge, and the module-serial tagging of AI monitoring data, as new interface risks. This estimation is a scenario based on assumed values substituting for undisclosed actual line specifications, and requires further verification before application to an actual mass-production line.
1. Immersion Cooling Is Not a Cooling Problem, It Is a Line-Balancing Problem
To state the conclusion first, the decision to add immersion cooling and AI cell monitoring to an assembly line is not a matter of cooling performance or inspection accuracy, but of line balancing and buffer design. Both processes are individually already-proven technologies, but inserting them as-is into an existing assembly line’s takt-time structure creates a bottleneck.
According to an August 19 report, DeltaX broke ground on a roughly KRW 200 billion dedicated BESS plant in Georgia, US, building a 9,290 m² production facility in Phase 1. The company introduced itself as holding selective immersion-cooling and AI-based cell-monitoring technology¹. The problem begins here — where and with how many stations to place the two processes of immersion-cooling injection/degassing/inspection and AI-monitoring self-diagnosis within the assembly line is an engineering decision not covered in a press release.
This article quantitatively reconstructs that decision from a line-balancing perspective. It is based not on DeltaX’s actual disclosed line specifications, but on a scenario assuming a scale commonly applied to ESS module assembly lines — in order to answer the question of how the line must be redesigned to keep the target takt time while adding cooling and inspection functions.
2. Line Balancing: The 46.7% Bottleneck Immersion Cooling Creates
Takt time is Available Operating Time divided by Customer Required Quantity, and is not conflated with cycle time or FPY. The estimation conditions are as follows: a Phase-1 target production capacity of 1.2 GWh/year (assumed), a module spec of 5.0 kWh/module with a pack configuration of 12 modules (assumed), and an availability of 85% applied over 3-shift, 300-day operation.
| Estimation Item | Value | Note |
|---|---|---|
| Theoretical available time | 25,920,000 s | 300 days × 24 h × 3,600 s |
| Available operating time | 22,032,000 s | Applying 85% availability (assumed) |
| Annual customer required quantity (packs) | 20,000 units | 1.2 GWh ÷ 60 kWh/pack |
| Pack takt time | 1,102 s/pack | Available operating time ÷ customer required quantity |
| Module takt time (target) | 92 s/module | Pack takt time ÷ 12 modules |
Adding the immersion-cooling station’s process time reveals the problem. Assuming sequential steps of 60 s coolant injection, 45 s vacuum degassing, and 30 s sealing/leak inspection, the time required per station is 135 s. This exceeds the target module takt time of 92 s by 46.7%, and this single station alone raises the line’s effective takt time to 135 s — even if every other process, such as assembly and inspection, meets its target, the result is the same. This is the article’s central insight: what determines whether to adopt immersion cooling is not cooling-performance data, but whether this one station is balanced within the line.
3. Buffer/Interface Design: Parallelization and FIFO Merging
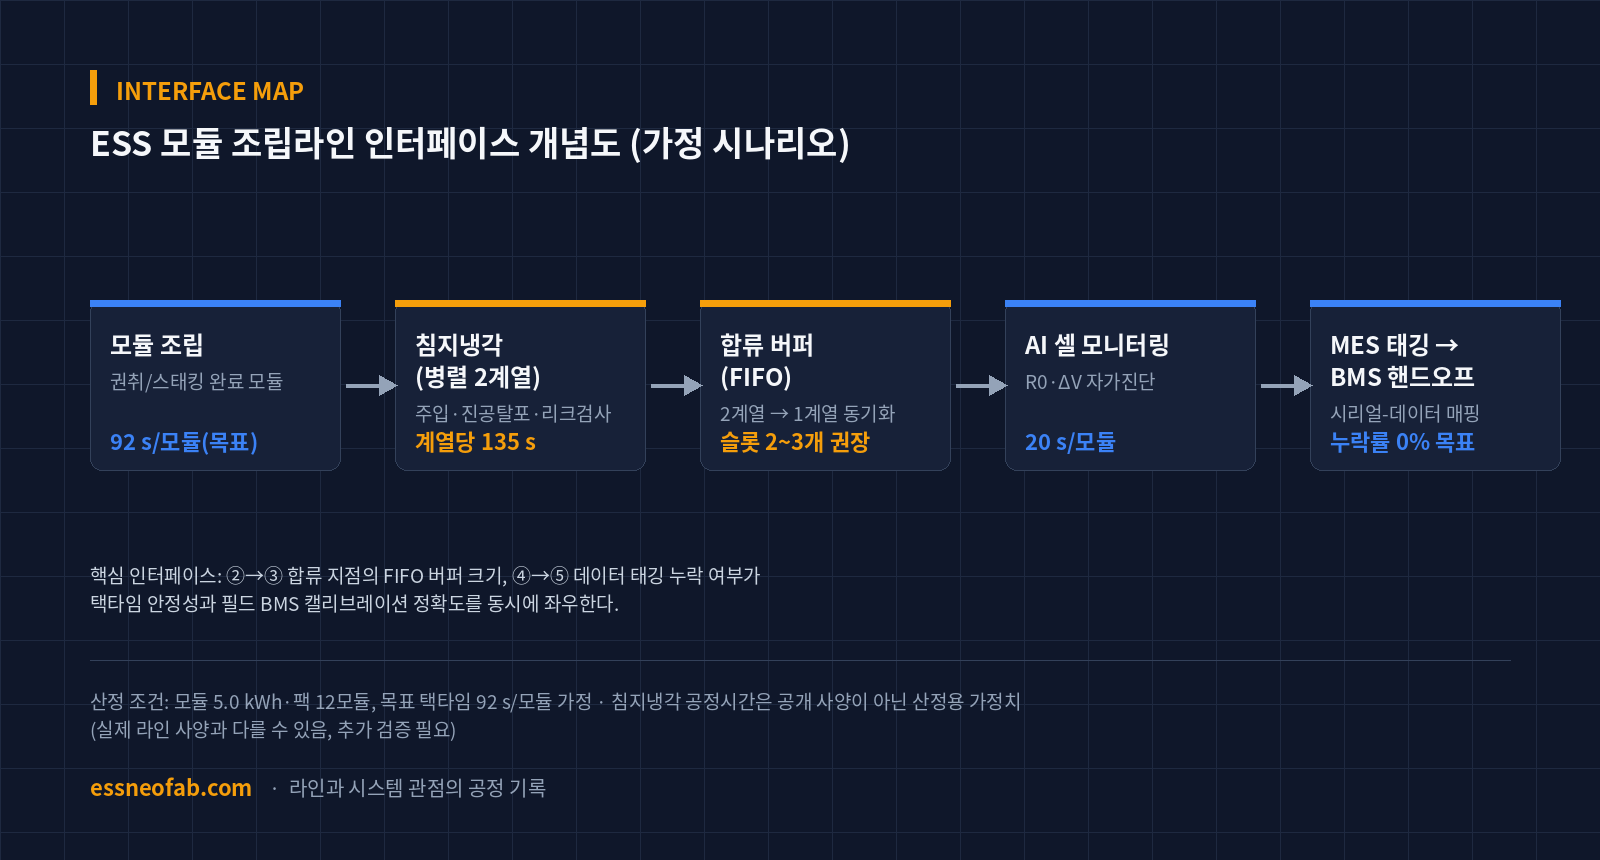
There are, in principle, two ways to resolve a bottleneck: reduce the process time itself, or parallelize the station. This article presents parallelization as the primary response, for three reasons.
First, vacuum degassing and leak inspection have a physical lower bound governed by fluid viscosity and pressure equilibrium, so forcing a shorter time can carry quality risks such as residual bubbles and uneven cooling. Second, on an actual line, statistical variation exists from deviations in injection volume and viscosity, so 135 s is an average, not an upper bound — matching the target with a single station would produce a persistent bottleneck during variation periods. Third, parallelization provides spare capacity so the entire line does not stop when a station fails.
Applying 2-line parallelization, the effective processing interval becomes 135 s ÷ 2 lines = 67.5 s, leaving a 24.5 s margin against the target takt time of 92 s. However, this margin is not free — a new interface arises at the point where modules produced at 67.5 s intervals from each of the two lines merge into a single downstream process (AI cell monitoring). The instantaneous arrival interval at the merge point can narrow to an average of 33.75 s, and this estimation concludes that, accounting for process variation (assumed ±15%), a minimum of 2–3 FIFO buffer slots must be secured to keep the flow uninterrupted.
4. Traceability: Mapping Self-Diagnosis Data to Module Serials
The AI cell-monitoring station is assumed to scan each module’s initial internal resistance (R0) and voltage deviation (ΔV) at a rate of 20 s/module. More important than this value itself is which module serial this data is combined with when tagged in the MES.
Operating parallel immersion-cooling lines can introduce minor process-parameter deviations between the two lines, such as coolant lot or vacuum-degassing pressure. AI monitoring data must therefore be tagged not only with the module serial but also with which immersion-cooling line it passed through (station ID), so that when an anomaly is found in the field, retroactive tracing can narrow the cause down to a specific line and specific period. Because omitting this tag makes it impossible to identify the causal line through any later statistical cross-verification, this tagging is not a quality-system after-the-fact measure but an interface requirement that must be fixed at the line-design stage.
5. ESS System-Layer Linkage and Remaining Issues
The initial R0/ΔV values obtained from AI cell monitoring are, in some cases, used in the field as calibration reference values when the BMS estimates SOC/SOH. From a line designer’s perspective, the hypothesis is that if these initial values are not precisely mapped to the module serial and handed off from the line to the BMS, field SOC/SOH estimation error can remain in a form whose cause cannot be identified from assembly-line records. However, whether this handoff has a statistically significant correlation with actual field performance variation is beyond the scope of this estimation and requires separate review.
At the PCS/EMS layer, it is typical not to directly reference assembly data, but it is worth noting only that large initial pack-level performance variation can increase the EMS’s string-balancing burden during operation. This causal relationship likewise cannot be substituted 1:1 from pilot or lab-scale data as mass-production-line performance, and is left as an area requiring cross-verification once measured data accumulates.
FAQ
Q1. Shouldn’t reducing the immersion-cooling process’s own time be prioritized over parallelization?
Reducing process time is a valid alternative and should be reviewed in parallel. However, vacuum degassing and leak inspection have a physical lower bound set by fluid viscosity and pressure equilibrium, so forcing a reduction can carry quality risks such as uneven cooling from residual bubbles. This article presents parallelization as the primary response not because reducing process time is unnecessary, but because parallelization is a relatively stable primary response for a process with a physical lower bound. The optimal combination of the two methods requires separate review once actual equipment specifications are fixed.
Q2. Does this calculation reflect DeltaX’s actual line specifications?
No. The information DeltaX disclosed is limited to the investment scale ($141 million), the Phase-1 site area (9,290 m²), and its possession of immersion-cooling and AI cell-monitoring technology; line-design figures such as takt time, module spec, and process time were not disclosed. Every figure in this article is an assumption set to fill that gap and may differ from the actual line specification. The purpose is not to estimate DeltaX’s line, but to show what interface-design questions arise when integrating this type of function into an assembly line.
Field Application Notes
The table below lists items that can be checked immediately starting Monday morning on a project integrating immersion cooling and AI monitoring into an assembly line.
| Checkpoint | Verification Method | Target Standard (Assumed) |
|---|---|---|
| Measured immersion-cooling station process time | Sample at least 3 times via PLC log or stopwatch | Within ±10% of module takt time |
| Number of merge-buffer slots for parallel lines | Line simulation or FIFO queue log analysis | At least 2 slots; wait time within 30% of takt time |
| AI monitoring data–module serial tagging | Retroactive trace test on a 100-record MES log sample | 0% tagging omission rate |
| BMS initial calibration handoff | Reconcile field-returned data against line data | Within 1 mismatch per month (assumed target) |
This estimation is an assumption-based scenario built under limited disclosed specifications. It must be cross-verified against measured data before application to an actual line design.
Reference: report on DeltaX’s Georgia BESS plant groundbreaking (August 19, 2026), theguru.co.kr
Related Reading
- 46-Phi Cylindrical Cell Line Conversion: The Pressure-Sensor–BMS Interface Determines Takt Time
- Embedding an AI Vision Inspection Gate in the Line: Redefining OEE and Takt-Time Design Variables
- Sebang Lithium Battery’s Simultaneous HEV Pack and ESS Module Orders — Analyzing the Cell-Inbound Interface and Cell-ID Traceability Load


You May Also Like
A 160 MW battery’s six-week commissioning has two baselines
Designing the Merge Point in a 10 GWh Pack-Container Integration Line: Synchronizing Two Upstream Lines and Sizing AGV Fleet from the Powertrac × Sunka Lead Order
One Comment
Pingback: