Sebang Lithium Battery’s Simultaneous HEV Pack and ESS Module Orders — Analyzing the Cell-Inbound Interface and Cell-ID Traceability Load
Abstract
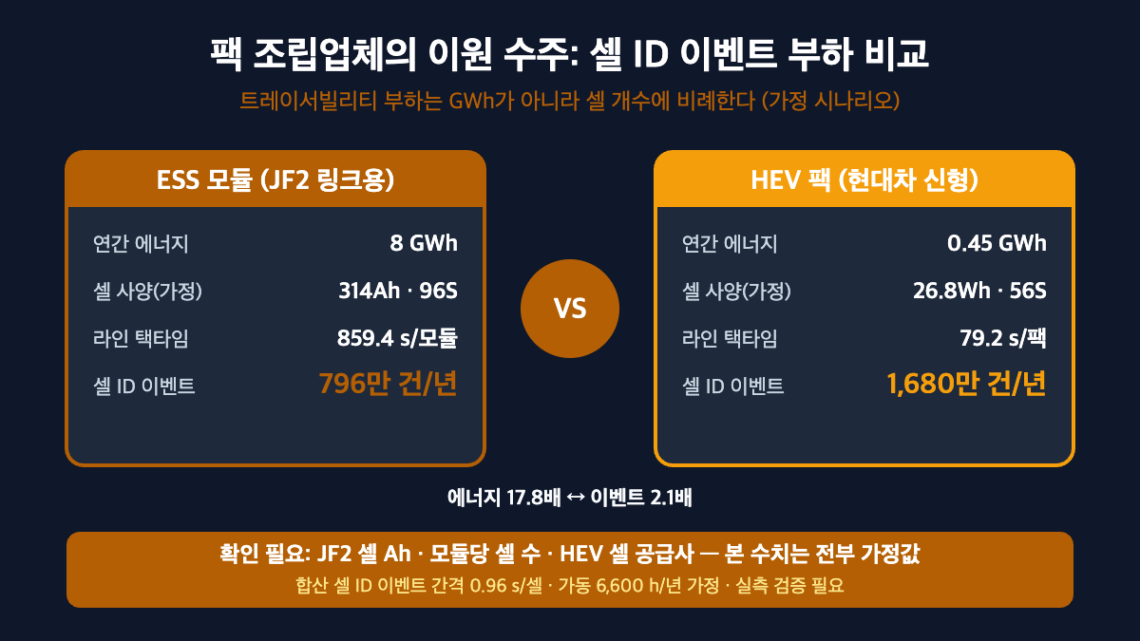
Sebang Lithium Battery simultaneously won orders for Hyundai Motor’s new hybrid (HEV) battery packs and LG Energy Solution’s new ESS (JF2) battery packs, together worth more than KRW 3 trillion (reported 2026-09-07). This article quantifies, under an assumed scenario, how the Cell Inbound Interface and Cell-ID Traceability load differ when a pack systems company that sources cells externally receives two heterogeneous product lines — automotive and grid-scale power — within a single organization. The conclusion is that the traceability system’s load scales with cell count, not GWh. In the assumed scenario, the HEV pack, at 0.45 GWh/year, is only 1/17.8 the scale of the ESS module (8 GWh/year), yet its cell-ID event count of 16.8 million/year is 2.1 times that of the ESS module (7.96 million). All figures are assumed values and require empirical verification.
1. Two Customers, Two Specifications, One Traceability System
To state the conclusion first: when a pack assembler simultaneously receives HEV packs and grid-scale ESS modules, what must be designed first is not the assembly Takt Time but the interface layer that absorbs the Cell-ID Event Rate and the two divergent tracking specifications. The situation (S) is as follows. Sebang Lithium Battery is a battery systems company that receives cells from cell manufacturers and supplies them to OEMs and ESS customers in module/pack form; it has now secured multi-year contracts for Hyundai Motor’s new HEV packs bound for U.S. export and LG Energy Solution’s JF2 ESS battery packs.[1] On the ESS side, its Ohio subsidiary will produce battery modules for LG Energy Solution’s ‘JF2 LINK’ across a total of three lines, targeting a Q3 pilot, first shipment in Q4, and annual revenue of KRW 800 billion once mass production stabilizes in 2027.[2]
The complexity (C) lies in the fact that the cell specifications, customer requirements, and certification regimes for the two product lines are entirely different. The question (Q) is: “Can the same MES (Manufacturing Execution System)[3] and scanner infrastructure handle cell-to-module-to-pack traceability for both product lines?” The answer (A) becomes apparent once the cell-level event rate is calculated first — because the HEV line, despite its smaller total energy, turns out to be the primary driver of the traceability load.
2. Assumed Scenario: Back-Calculating the Cell-ID Event Rate
The article discloses neither cell specifications, module configuration, nor production volumes. The following is therefore an explicit assumed scenario, and each value is an item requiring verification. Operating time is assumed at 300 days/year × 2 shifts × 22 h = 6,600 h/year. Takt Time[4] is fixed as available operating time ÷ customer required quantity.
| Item | ESS Module (for JF2 LINK, Ohio, 3 lines) | HEV Pack (Hyundai’s new HEV) | Notes |
|---|---|---|---|
| Annual energy | 8 GWh (assumed) | 0.45 GWh (assumed: 1.5 kWh × 300,000 packs) | Unit price undisclosed; GWh figures are independent assumptions |
| Cell spec | 314 Ah × 3.2 V = 1,004.8 Wh (assumed) | 26.8 Wh/cell (assumed) | JF2 and HEV cell specs require verification |
| Cells per unit | 96 cells/module (assumed) → 96.46 kWh/module | 56 cells/pack (assumed) | Requires verification |
| Annual unit count | 82,935 modules | 300,000 packs | Calculated value |
| Annual cell-ID events | 7,961,760 | 16,800,000 | Based on one inbound scan per cell |
| Cell-ID event interval | 2.98 s/cell (plant-wide) | 1.41 s/cell | Based on 6,600 h |
| Line Takt Time | 859.4 s/module (3 lines, evenly split) | 79.2 s/pack (1 line, assumed) | Available operating time ÷ customer required quantity |
What the figures show is clear. In energy terms, ESS is 17.8 times HEV, but in cell-ID events, HEV is 2.1 times ESS. Converted to events per GWh, HEV comes to approximately 37.3 million events/GWh versus ESS’s approximately 1.0 million events/GWh — a 37-fold difference. The smaller a single cell’s energy, the more scans, gradings, and database writes are required to produce the same total energy, and this grows sharply. This is the core observation of this article: the processing capacity of the traceability infrastructure (scanner count, MES transaction throughput, database write performance) must be sized against a cell-count plan, not a GWh plan.
3. The Interface Layer: Cell Inbound and Hierarchical ID Mapping
The two product lines differ from the cell source onward. The ESS module’s cells are LG Energy Solution JF2 cells, while the cell supplier for the HEV pack is not disclosed in the article (requires verification). The cell inbound interface consists of four stages: (a) receiving incoming-lot inspection data, (b) scanning each cell’s individual ID (2D code), (c) mapping grading data such as OCV and internal resistance, and (d) linking this hierarchically to module ID and pack ID.
As prior art, CN111832676A claims a structure in which a cell’s 2D barcode, a module’s 1D barcode, and a pack barcode correspond and link hierarchically, with internal-resistance and voltage information retrievable together.[5] KR102148060B1 (filed by LG Chem, later transferred to LG Energy Solution) claims a method of identifying the physical location of a wireless communication module using micro-current after pack assembly,[6] suggesting that the mapping between module ID and its position within the pack must be verifiable even after assembly. Neither patent has a confirmed direct connection to the Sebang Lithium Battery case; both are cited as general prior art.
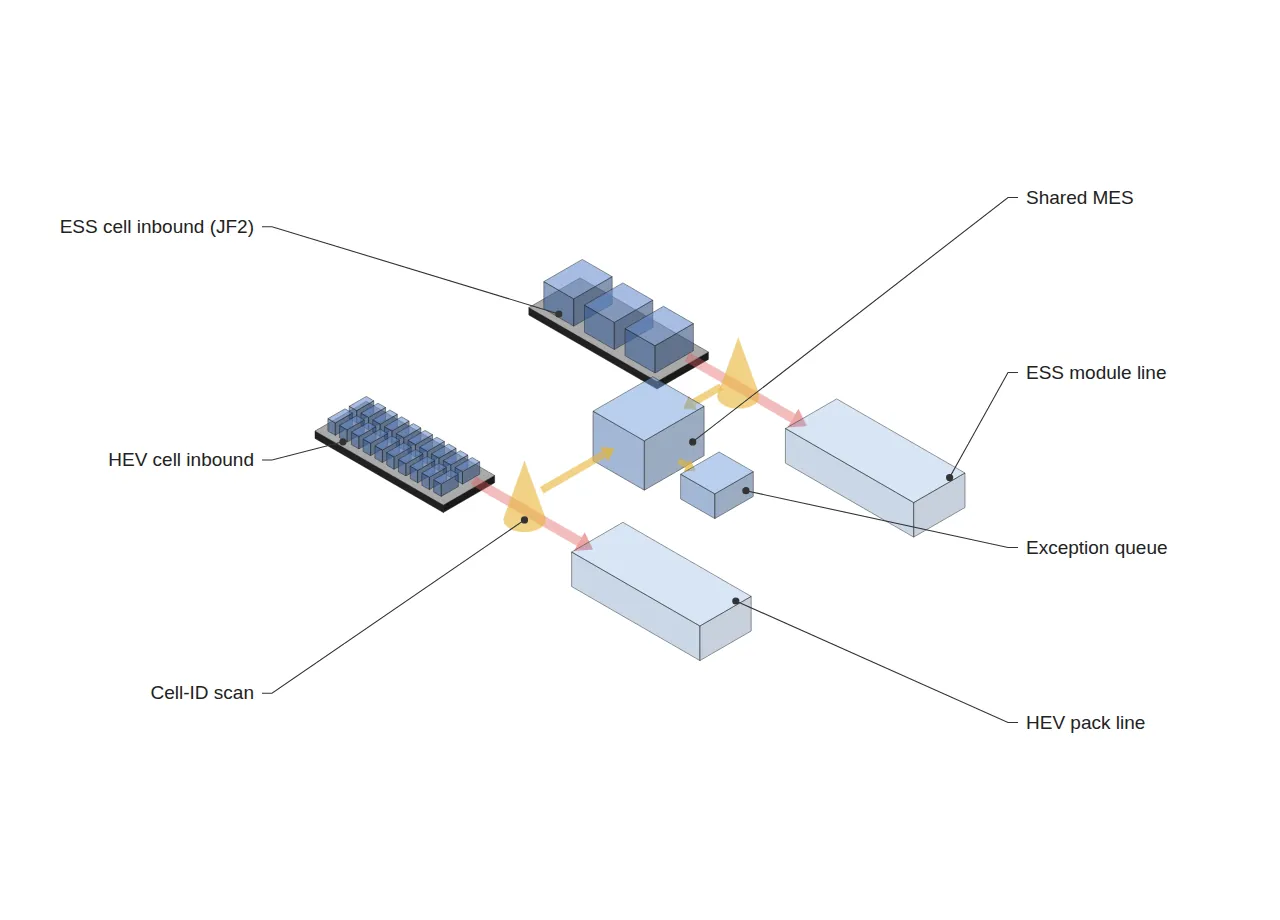
| Interface item | ESS Module (grid-scale) | HEV Pack (automotive) | Design implication |
|---|---|---|---|
| Cell source | LG Energy Solution JF2 (single source) | Undisclosed (requires verification) | ID coding schemes may differ by source |
| Basis for tracking requirement | Certifications such as module UL 1973 / system UL 9540, and customer requirements (details require verification) | OEM quality system based on IATF 16949 (details require verification) | A dual-specification schema is needed within a single MES |
| ID hierarchy depth | Cell → Module → M-LINK → System (including E-panel) | Cell → Module → Pack → Vehicle VIN | Similar number of hierarchy levels; different terminal linkage targets |
| Event interval (assumed) | 2.98 s/cell | 1.41 s/cell | Combined average of 0.96 s/cell → scanner redundancy required |
The combined load also needs to be checked. If a single MES processes both product lines, it would handle 24.76 million transactions/year at an average of 0.96 s/cell. Even a 0.5% (assumed) scan failure rate would generate 120,000 rescans/manual mappings per year, so in interface design, the capacity of the exception queue matters as much as the normal-processing throughput.
4. Trend Snapshot
First, Inometry won an order for CT inspection equipment for Samsung SDI StarPlus Energy’s (SPE) third ESS LFP line for approximately KRW 5 billion, bringing its total across three lines to approximately KRW 15.8 billion (reported 2026-09-01). Line 1 starts operating in October, producing 273 Ah-class prismatic LFP cells.[7] If CT inspection data from the cell manufacturer is combined with cell ID and passed to the pack assembler, stage (c) of the inbound interface discussed in Section 3 above must be able to absorb that data.
Second, at the system layer, Google-funded PG&E’s Virtual Power Plant (VPP)[8] program ‘SHARE’ will run a proof of concept through 2027 that registers approximately 21,000 existing residential flexible-load resources to supply 12 MW at peak (reported 2026-09-07).[9] Because module-level ID must remain traceable through the operational stage for the EMS (Energy Management System)[10] to distinguish performance by individual asset, manufacturing traceability is a chain that extends into the operations layer.
5. Conclusion and Implications
The Sebang Lithium Battery case shows that a pack assembler’s dual-order situation creates a bottleneck first in the traceability event rate, not the assembly Takt Time. In the assumed scenario, the HEV pack had 17.8 times less energy than the ESS module but 2.1 times more cell-ID events, with a combined average interval of 0.96 s/cell. However, this result rests entirely on assumed cell specifications and quantities, and will need to be recalculated once the actual JF2 cell capacity, HEV cell supplier, and production site are confirmed. This article addresses a different layer from grid-ESS volume-allocation load transfer onto a pack assembly line or capacity allocation between two production sites — it concerns the cell inbound interface and ID event load internal to a single assembler.
FAQ
Q. Cell-ID scanning takes under a second — why is 0.96 s/cell a bottleneck?
A. The scan itself is not the bottleneck. The bottleneck is the MES transactions that follow the scan — grading-data lookup, module-slot assignment, database writes, and exception judgment. Multiplying 24.76 million transactions/year by a 0.5% exception rate yields 120,000 manual interventions/year, and the time spent on this exception handling eats into the line Takt Time (79.2 s/pack for HEV). The actual bottleneck is exception-queue capacity, not the normal-processing throughput.
Q. Couldn’t the HEV pack and ESS module simply be split onto separate MES systems?
A. That is possible, but with two cell sources already and the system needing to expand every time a new customer is added, it becomes cumbersome. Maintaining a dual-specification schema within a single MES and normalizing the coding scheme at the interface layer is more advantageous for scalability. That said, this is a design principle — the actual choice requires separate review based on customer audit requirements and IT resources.
Field Application Notes
| Action item | Monday-morning action | Deliverable |
|---|---|---|
| Cell-count-based resizing | Divide each product line’s annual GWh by cell Wh to calculate the annual cell-ID event count, and list it alongside the GWh plan | Cell-event plan (by product line) |
| Event interval calculation | Calculate the event interval by product line and combined, as available operating time (s) ÷ annual cell count (using this article’s 2.98 s / 1.41 s / 0.96 s method) | Scanner/MES throughput requirement spec |
| Defining exception-queue capacity | Apply the scan failure rate (assumed 0.5%) and multiply the annual exception count by the manual-handling time per case (assumed 60 s) to calculate exception-handling labor | Exception-handling staffing and queue-length criteria |
| Dual-specification schema | List the tracking fields required by automotive and ESS customers, separating common fields from unique fields | Draft MES schema |
| Collecting items requiring verification | Request confirmation of JF2 cell Ah, cells per module, HEV cell supplier and specs, and HEV pack production site | Assumed-to-measured value substitution table |
Notes
- Korea Economic Daily (Hankyung), “[Exclusive] Sebang Battery scores ‘jackpot’ orders worth trillions of won from Hyundai and LG,” 2026-09-07.
- TheElec, “Sebang Lithium Battery partners with LG Energy Solution on KRW 1.8 trillion North American ESS supply deal,” 2026-06-15.
- MES (Manufacturing Execution System): a line-operations software layer that collects and directs equipment, material, and quality data in real time.
- Takt Time = available operating time ÷ customer required quantity. Not used interchangeably with Cycle Time. OEE = Availability × Performance × Quality.
- CN111832676A, “Lithium battery production traceability system based on bar code,” published 2020-10-27. Cited as general prior art.
- KR102148060B1, “Apparatus and method for identifying battery cell module location,” registered 2020-08-25, Claim 1. Cited as general prior art.
- TheElec, “Inometry sweeps up CT inspection equipment orders for Samsung SDI’s U.S. ESS batteries,” 2026-09-01.
- VPP (Virtual Power Plant): a system layer that aggregates distributed battery and load resources via software to operate them as a single generation resource.
- Energy-Storage.News, “Google, Tesla, Sunrun, and PG&E partner on new California virtual power plant programme,” 2026-09-07.
- EMS (Energy Management System): a layer above the BMS (Battery Management System) and PCS (Power Conversion System) that determines charge/discharge scheduling and grid response.
Note on measurement conditions: all figures in this article are the result of an assumed scenario (6,600 operating hours/year; assumed cell, module, and pack specifications and quantities) and are calculated values without sample size or temperature/humidity conditions. They should not be substituted 1:1 for mass-production line performance, and further verification is required.
Related Reading
- Cell Traceability: Where Does It Break Down at the Line Level?
- 128 MW of Distribution-Grid ESS Volume Allocated — Can the Battery Pack Assembly Line Absorb the Takt Time?
- SK On’s Dual-Site ESS Production Bases — Where Fixed Contracts and Variable Bidding Split Takt Time Design


You May Also Like
Re-Reading the ESS Grid-Interconnection Queue in the Language of Line Balancing
Formation Channel Sizing Read from a Cell Assembly Equipment FAT — How 1 Second of Takt Time Moves 3,350 Channels
4 Comments
Pingback:
Pingback:
Pingback:
Pingback: