-
FAT and SAT Differ in More Than Location — How IEC 62381:2024 Defines the Tests
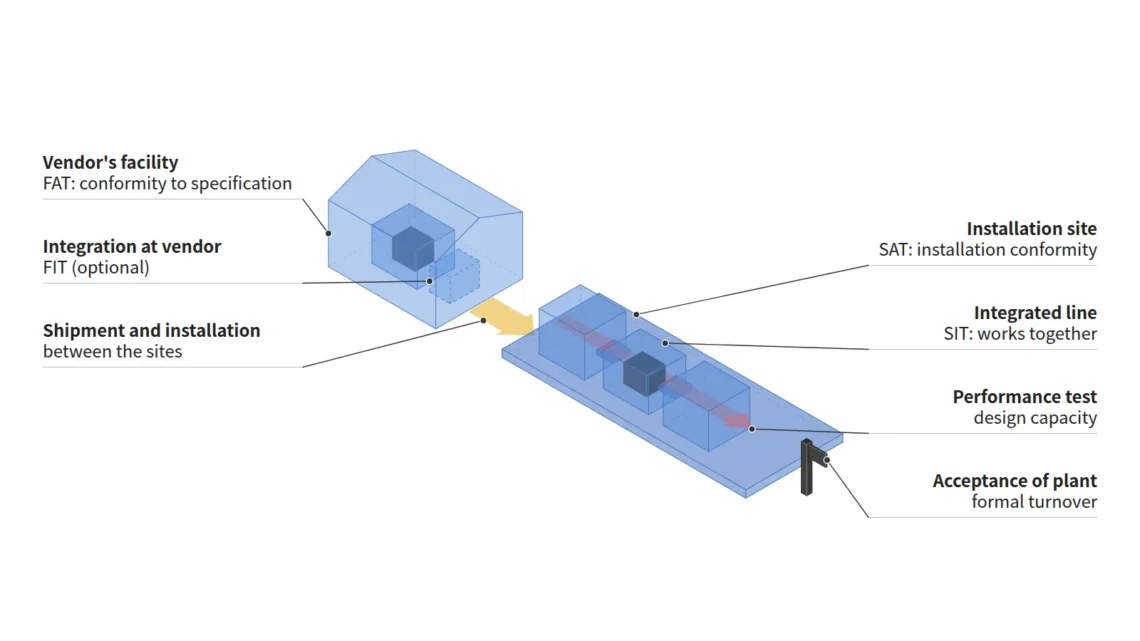
IEC 62381:2024 defines the factory acceptance test (FAT) as an activity to demonstrate that the automation system is in accordance with the specification, typically conducted at the vendor's facility, and the site acceptance test (SAT) as an activity to demonstrate, at the site of the installation, that the installation is in accordance with the applicable standards, codes, specifications, and installation instructions. The two tests differ not only in location but also in what they demonstrate, and the 2024 edition adds the optional factory integration test (FIT) and defines requirements and checklists for the FAT, FIT, SAT, and site integration test (SIT). Loop checks and commissioning lie outside the scope of…
-
If Availability, Performance and Quality Are All 80 %, OEE Is 51.2 % — How to Calculate OEE
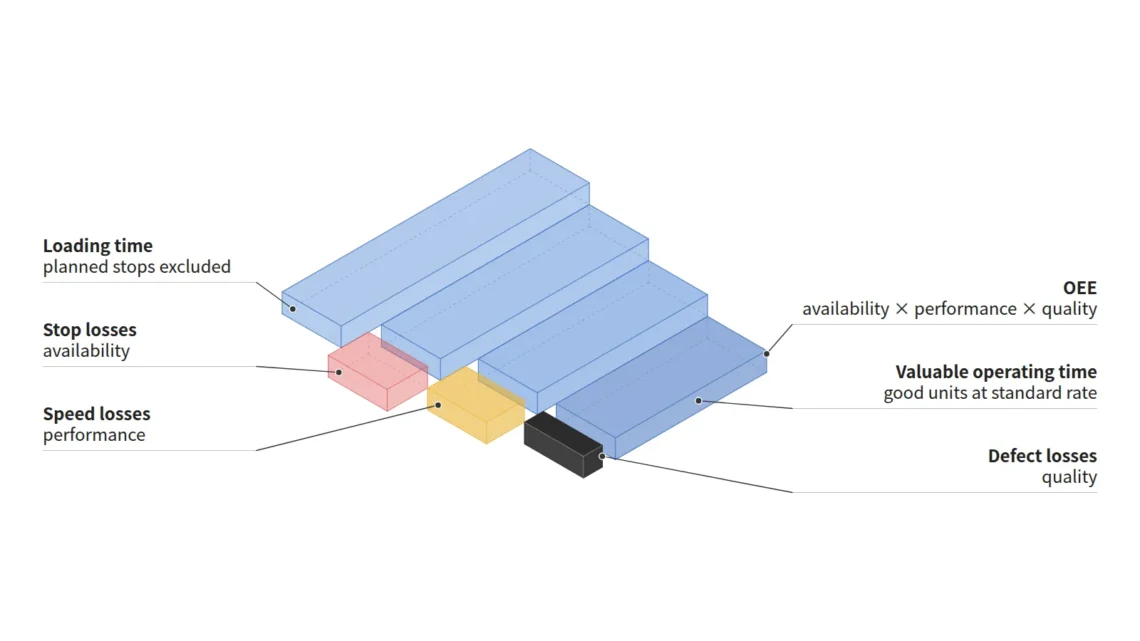
OEE (overall equipment effectiveness) is calculated as availability × performance × quality, and the Japan Institute of Plant Maintenance (JIPM) gives the example that when all three factors are 80 %, OEE is 51.2 %. When the three factors are multiplied as JIPM defines them, OEE is organized as "standard (planned) cycle time × number of good units ÷ loading time," that is, the share of loading time spent making good units at the standard speed. In an assumed shift (loading time 27,600 s, standard cycle time 32 s, 690 good units), availability is 90.0 %, performance 90.4 % and quality 98.3 %, giving an OEE of 80.0 %. If…
You May Also Like
A 2.5 GWh Line Fed Only 1 GWh of Cells — OEE of 36.9% and 83.8% Describe the Same Line
Linking Cell History in Formation and Aging: History Contamination from Tray ID + Slot Mapping
Even a tenfold faster model moves the whole by 1.29x — what “5 to 10 times faster commissioning” actually requires
-
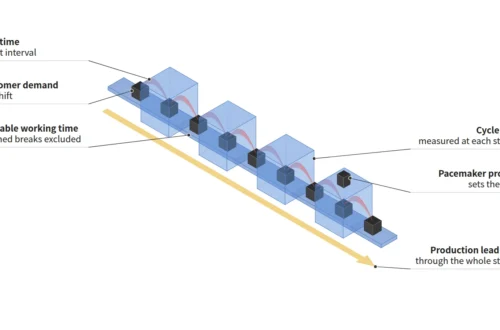
Don’t Subtract Breakdowns When Calculating Takt Time — Takt Time vs. Cycle Time vs. Lead Time
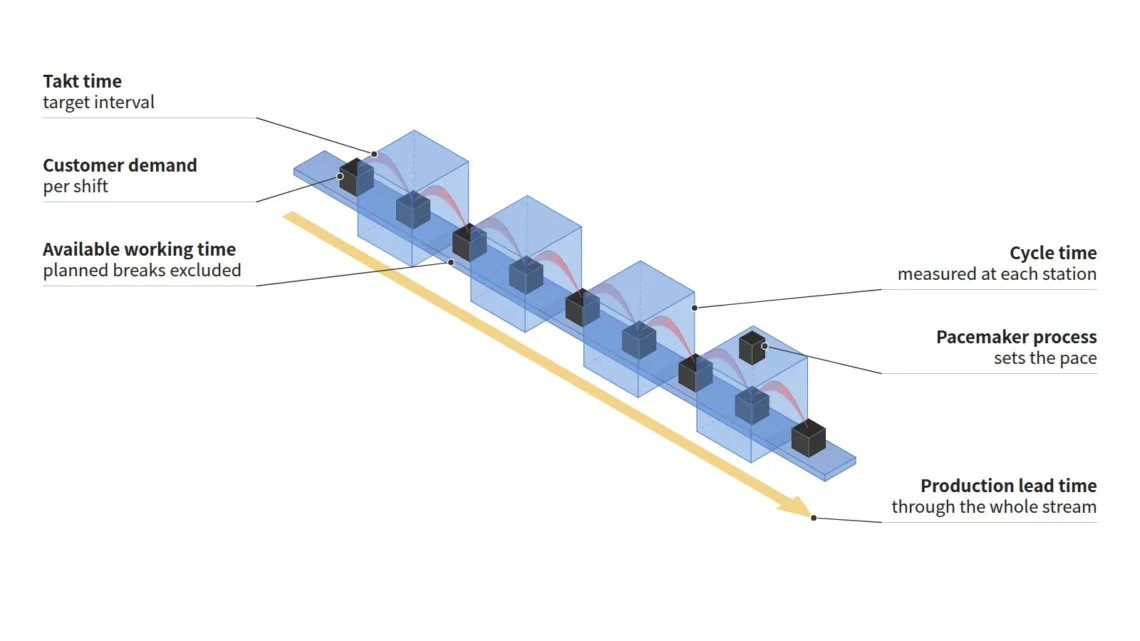
Takt time is the target production interval obtained by dividing available working time by customer demand, whereas cycle time is the measured time a process actually takes to make one unit. The calculation rule in the workbook published by the Lean Enterprise Institute (LEI) subtracts from shift time planned operator breaks, meetings, cleanups, etc., but not time for unplanned machine downtime, changeovers or other internal problems. Dividing the 27,600 s of available working time per shift obtained under this rule by the demand per shift of 690 units gives a takt time of 40 s. To cover stopped time as well, the measured cycle time must be shorter than takt…
You May Also Like
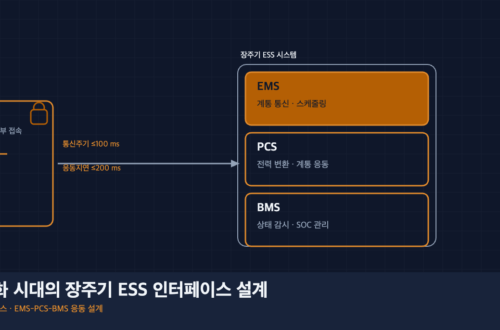
Long-Duration ESS Interface Design in the Era of Power-Grid Saturation
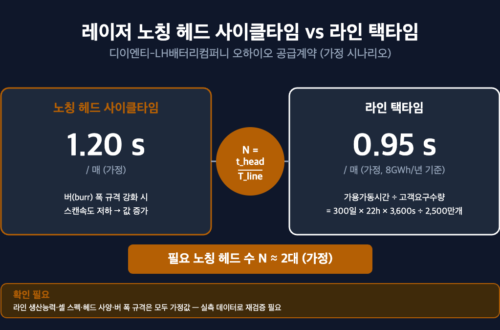
The Interface Between Laser Notching Cycle Time and Line Takt Time — The Head-Count Sizing Problem Revealed by DI ENT’s Ohio Supply Contract
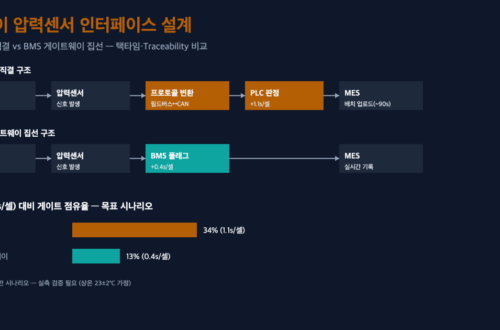
46-Phi Cylindrical Cell Line Conversion: The Pressure-Sensor–BMS Interface Determines Takt Time
-
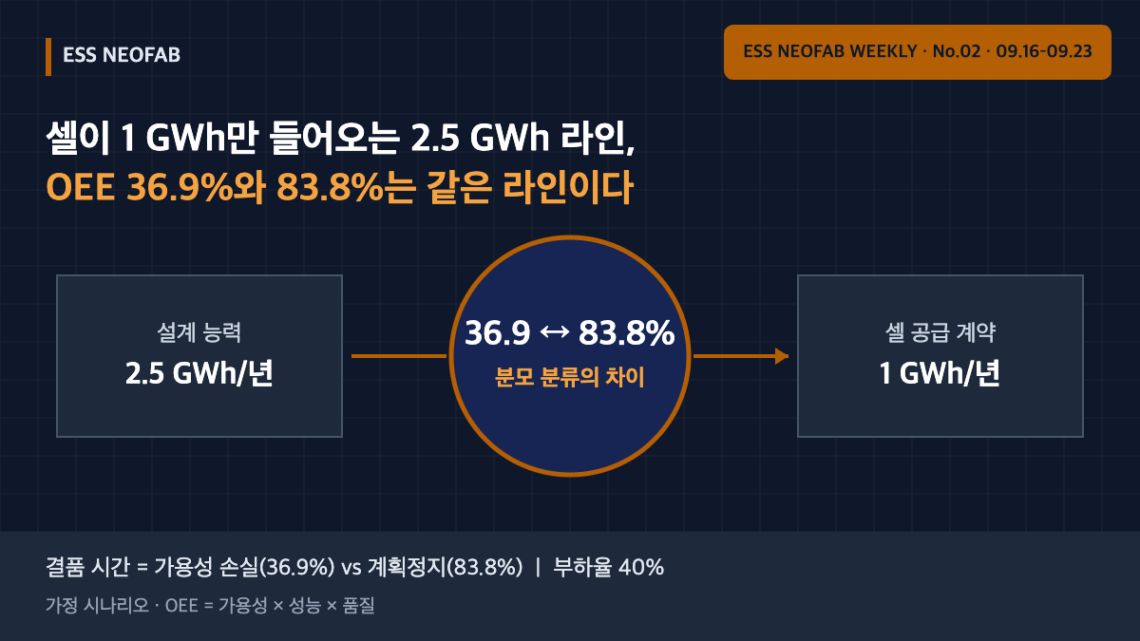
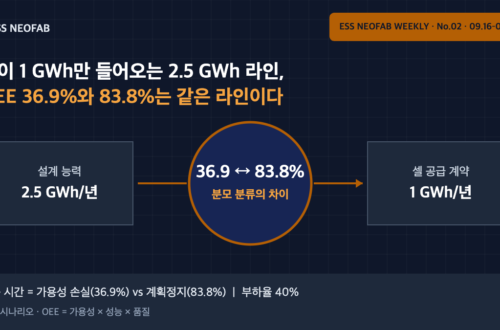
A 2.5 GWh Line Fed Only 1 GWh of Cells — OEE of 36.9% and 83.8% Describe the Same Line
Advait Group’s supply agreement with Hithium for 314 Ah LFP cells (up to 1 GWh over the next year, 18 September 2026) feeds a 2.5 GWh/yr assembly plant with only 40% of its design capacity. Under an assumed scenario, the same line with the same output reports an OEE of 36.9% if cell-shortage time is counted as availability loss, and 83.8% if it is separated as planned downtime and available operating time is matched to supply. The 46.9-point gap comes from the OEE denominator rule, not the equipment; on supply-constrained lines, the loading ratio should be reported alongside OEE.
-
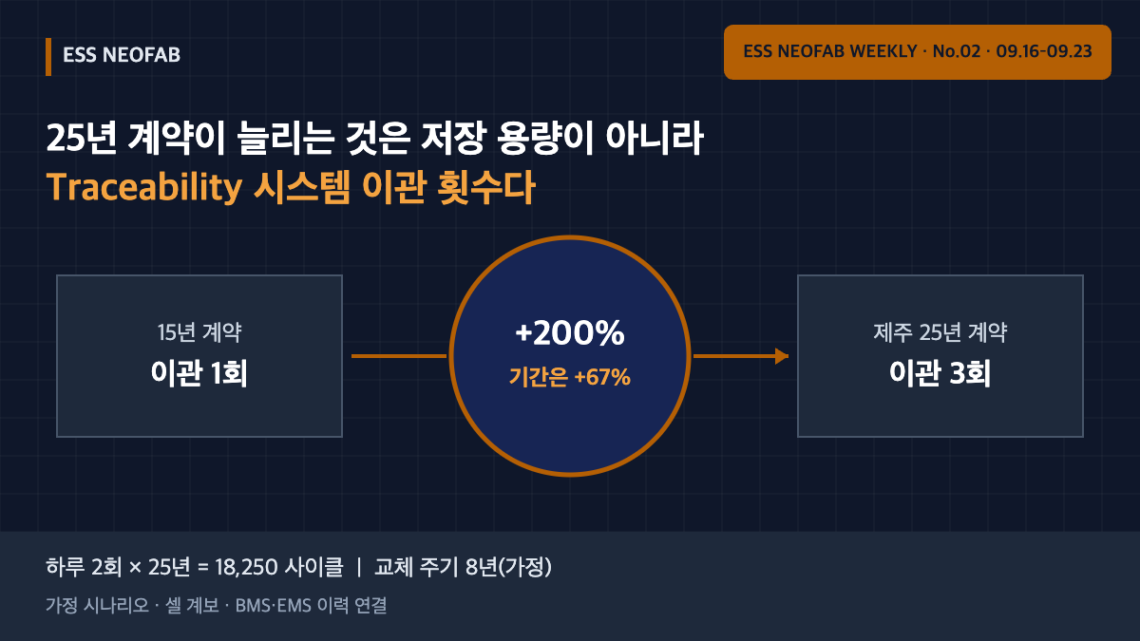
A 25-Year Contract Increases Migrations, Not Storage — Traceability Design for Jeju Long-Term ESS Contracts
Korea’s 2026 ESS central contract market (1,180 MW, opened 22 September 2026) introduced, for the first time, a 25-year contract on Jeju for facilities capable of two charge/discharge cycles per day for 25 years. A longer contract lengthens the retention period for cell-level Traceability records. Under an assumed scenario (8-year system replacement cycle), the contract term grows by 67% but Traceability system migrations triple from one to three, while one generation of cell records is only about 15.9 GB. The design constraint of a 25-year contract is not storage but genealogy breaks at each migration.
You May Also Like
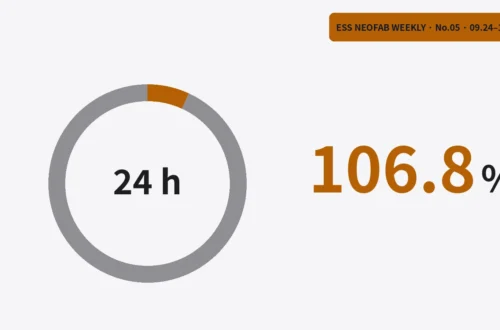
Two Cycles a Day Take 106.8 % of a Day, and the Retention Tier Shifts Cell Volume by 1.47 GWh
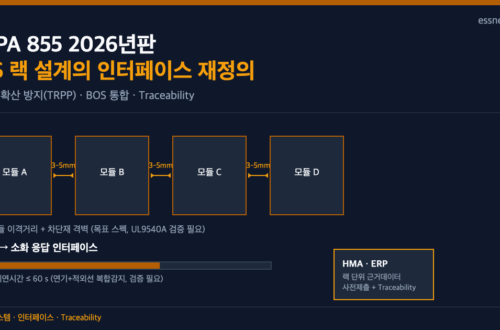
The 2026 Edition of NFPA 855 Changes ESS Rack Design and Traceability Documentation at the Same Time
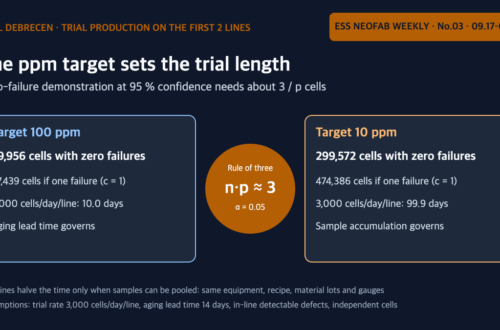
CATL Starts Trial Production in Debrecen — The Digits of the Defect-Rate Target, Not the Equipment, Set the Length of a Trial Run
-
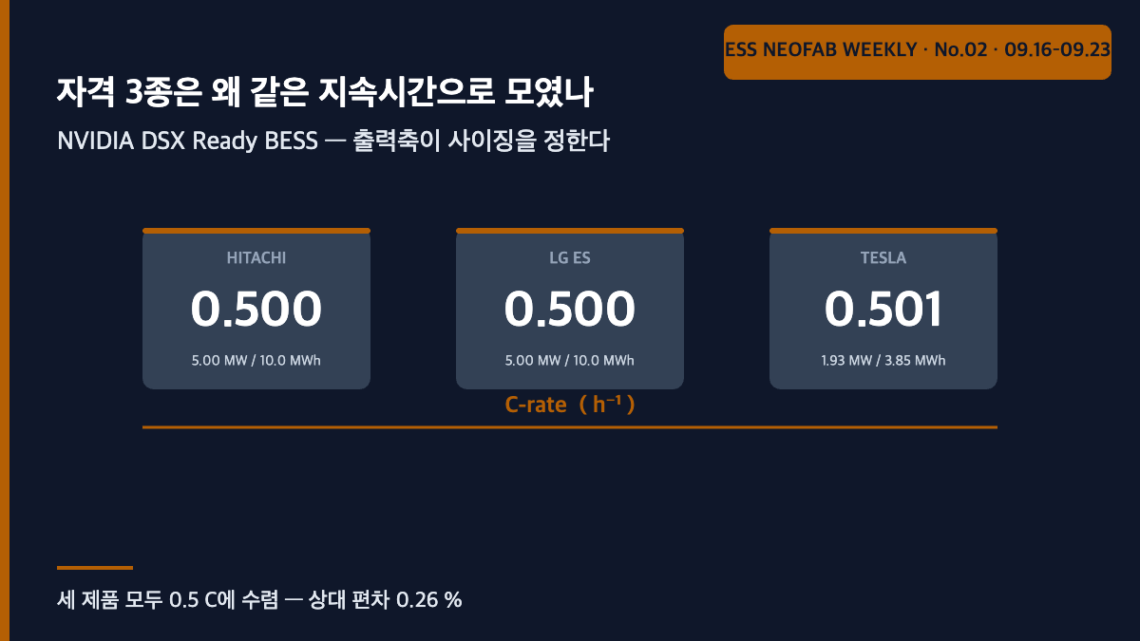
Why three qualified products landed on the same duration — in DSX Ready BESS, sizing is set by the output axis
NVIDIA's DSX Ready qualification programme, launched 21 September 2026, lists three BESS offerings whose C-rates converge within 0.26 % at 0.5 C. Of the three qualified functions only demand response governs energy capacity; under a 100 MW / 30 s assumption load buffering carries a 240x energy margin for free. Sizing is dominated by the output axis, and the remaining design variable is unit granularity, not energy capacity.
You May Also Like
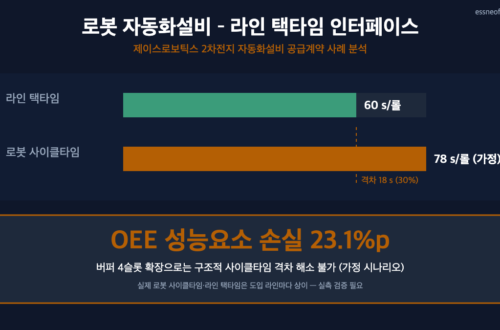
Introducing Robotic Automation Equipment — Where Does the Interface with Line Takt Time Break Down
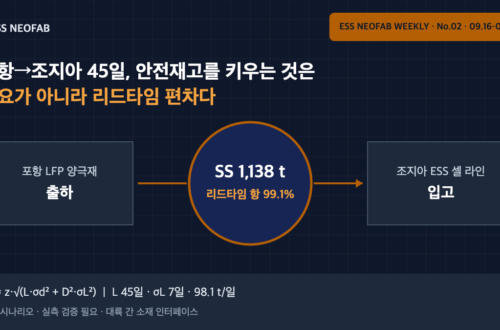
45 Days from Pohang to Georgia — Safety Stock at an Intercontinental Cathode Interface Is Driven by Lead-Time Variability, Not Demand
Long-Duration ESS Interface Design in the Era of Power-Grid Saturation
-
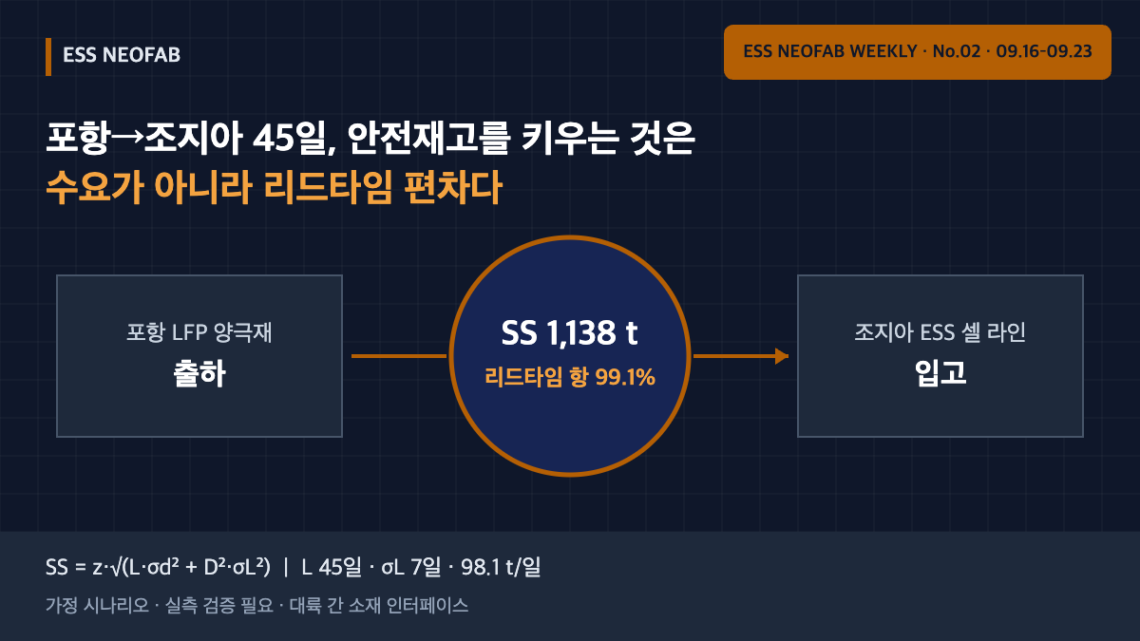
45 Days from Pohang to Georgia — Safety Stock at an Intercontinental Cathode Interface Is Driven by Lead-Time Variability, Not Demand
SK On’s roughly KRW 1.0742 trillion LFP cathode contract with POSCO Future M (2027–2029, for its Georgia ESS cell line) puts a continent and an ocean crossing between the materials and cell plants. Under an assumed scenario (45-day lead time, σL 7 days, 98.1 t/day), safety stock in front of the Georgia cell line is about 1,138 t, 99.1% of which comes from the lead-time variability term. Halving lead-time variability cuts it to 577 t; halving demand variability leaves it at 1,136 t. At an intercontinental interface, the management variable is the spread of arrival times, not the demand forecast.
You May Also Like
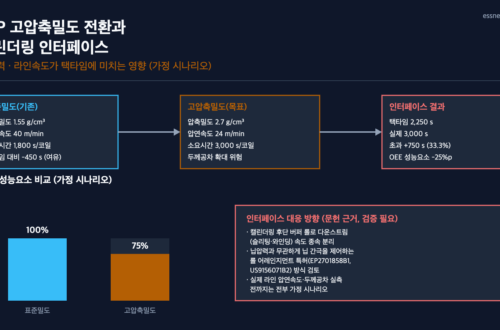
LFP High-Compaction-Density Conversion and the Calendering Interface: How Nip Pressure and Line Speed Affect Takt Time
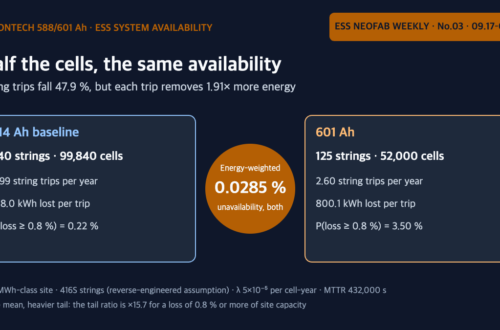
Pylontech’s 588 Ah and 601 Ah LFP Cells Enter Mass Production — Why Energy-Weighted Availability Stays the Same When the Cell Count Halves
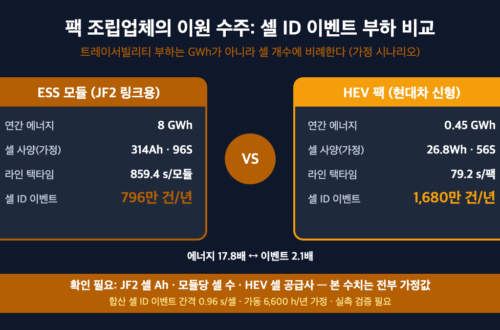
Sebang Lithium Battery’s Simultaneous HEV Pack and ESS Module Orders — Analyzing the Cell-Inbound Interface and Cell-ID Traceability Load
-
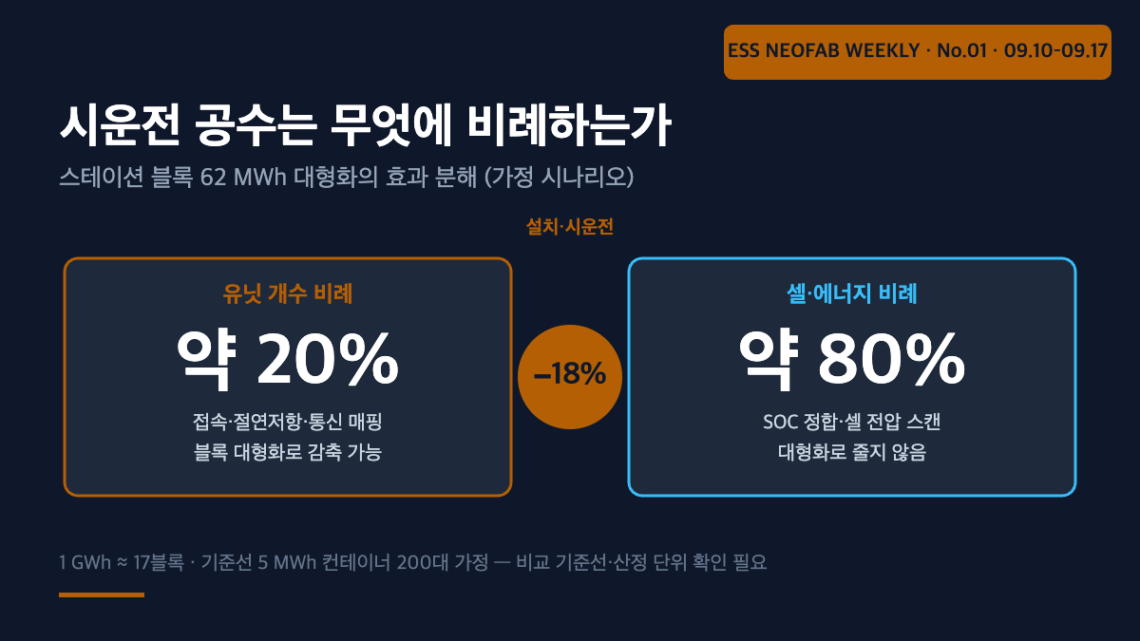
When the Station Block Grows to 62 MWh, What Actually Shrinks Is Commissioning Labor, Not Cell Count
On September 16, 2026, BYD unveiled its second-generation grid-forming station block, the "GC Block," in a maximum 10 MW/62 MWh single configuration, stating that a 1 GWh project would require approximately 17 blocks. The same announcement claimed a 69.4% reduction in BMS management complexity, a maintenance workload reduction of over 60%, and an installation/commissioning workload reduction of over 18%. Working backward from these three figures using the same assumed unit-count reduction rate (91.5% under a baseline assumption), the unit-count-proportional share of on-site commissioning labor turns out to be only about 20%, with the remaining roughly 80% proportional to cell/energy count. In other words, block enlargement is a lever that attacks…
You May Also Like
LFP High-Compaction-Density Conversion and the Calendering Interface: How Nip Pressure and Line Speed Affect Takt Time
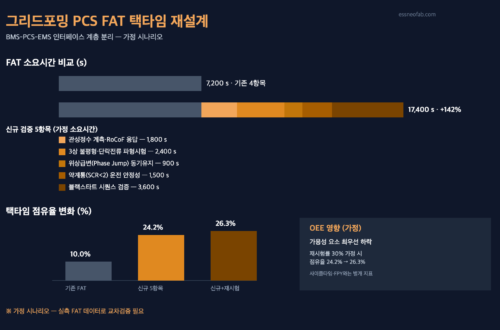
Grid-Forming PCS Mandate Redesigns FAT Takt Time and the BMS-PCS-EMS Interface
Don’t Subtract Breakdowns When Calculating Takt Time — Takt Time vs. Cycle Time vs. Lead Time
-
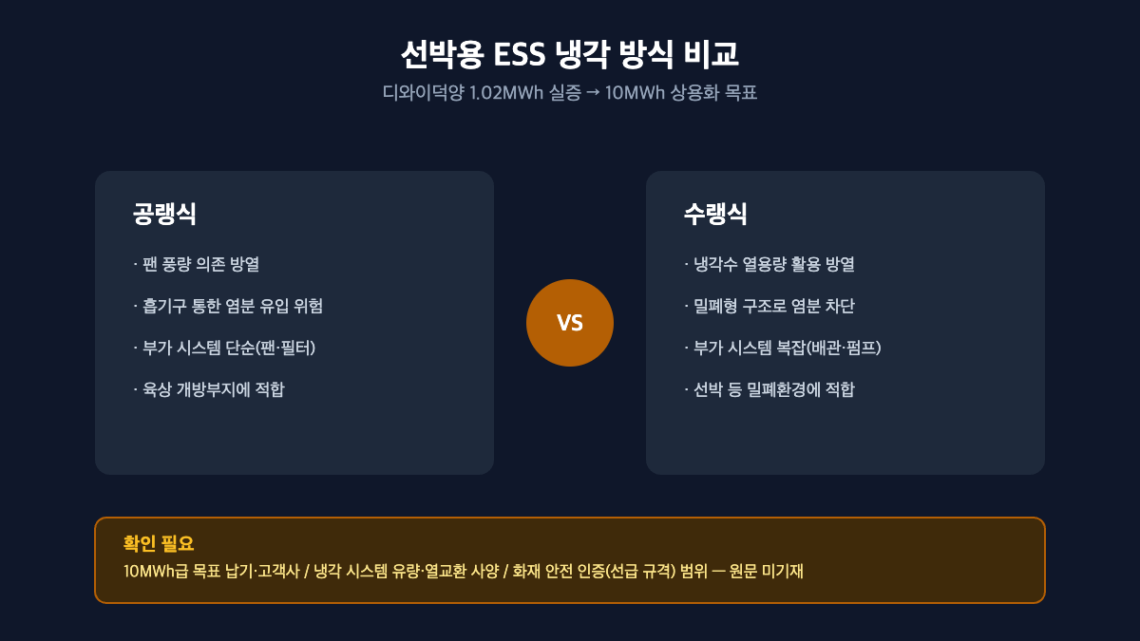
DY Duckyang’s 10 MWh-Class Marine ESS — What the Water-Cooled Demonstration Means for System Design
DY Duckyang has moved forward with a 10 MWh-class marine ESS business. The company has completed demonstration and certification of a 1.02 MWh-class water-cooled ESS and, building on this, is targeting supply of marine ESS at roughly 10 times that scale, at the 10 MWh class. While the battery system itself is similar between land-based and marine ESS, differing environmental constraints — installation space, vibration, and salt exposure — fundamentally diverge the cooling method and certification process design. This article organizes what completing the demonstration stage means from a system-design standpoint, and the nonlinear difficulty-escalation factors typically seen across a 10x scale-up. 1. Why marine applications require water cooling The…
You May Also Like
“Capturing the U.S. ESS Market” — K-Battery Supply Chain’s Wave of Localization: What’s Going Where
EU Battery Carbon Footprint Methodology Still Pending: How Line Energy Metering Resolution and Allocation Choice Shift Per-Cell Values
Hanwha Energy Sells Two Large Italian BESS Projects to Sweden’s OX2 — Evidence of European Development Capability
-
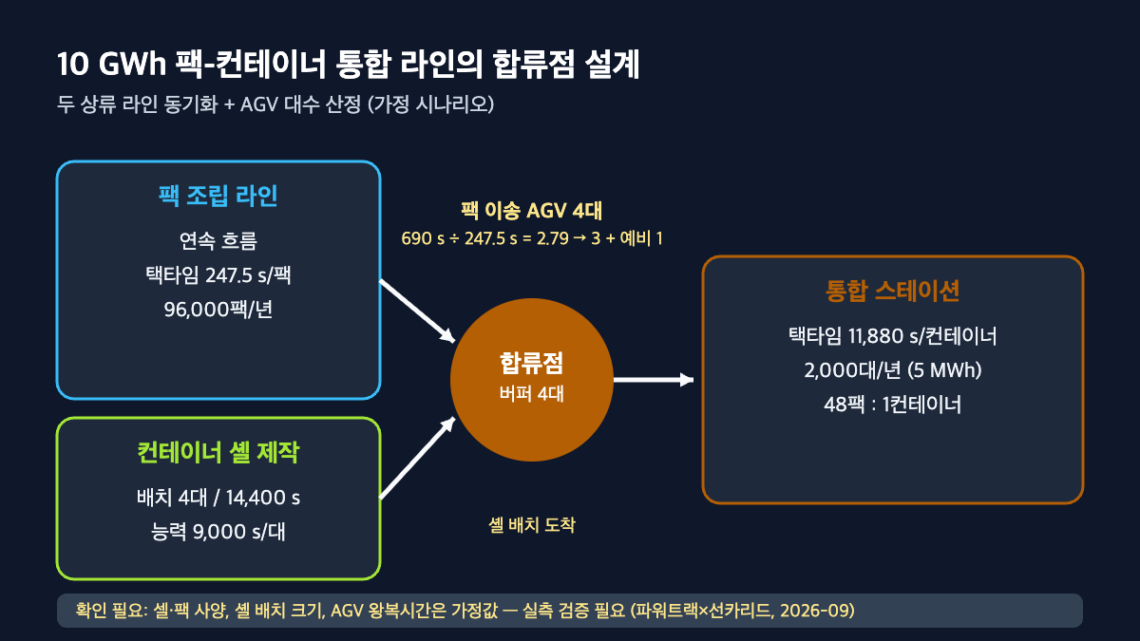
Designing the Merge Point in a 10 GWh Pack-Container Integration Line: Synchronizing Two Upstream Lines and Sizing AGV Fleet from the Powertrac × Sunka Lead Order
India's Powertrac has ordered a 10 GWh line from China's Sunka Lead in which a pack assembly line and an in-house container shell fabrication line — two upstream flows — merge at a single integrated station. In a two-input line of this kind, the first bottleneck appears not at the pack assembly takt time but at the merge point's synchronization buffer and the AGV transfer capacity linking the two flows. This article, under an assumed scenario (10 GWh/year, 5 MWh container baseline), back-calculates a container takt time of 11,880 s and a pack takt time of 247.5 s, and derives a design value of a minimum 4-unit merge-point buffer (assuming…
You May Also Like
The 2026 Edition of NFPA 855 Changes ESS Rack Design and Traceability Documentation at the Same Time
Sebang Lithium Battery’s Simultaneous HEV Pack and ESS Module Orders — Analyzing the Cell-Inbound Interface and Cell-ID Traceability Load
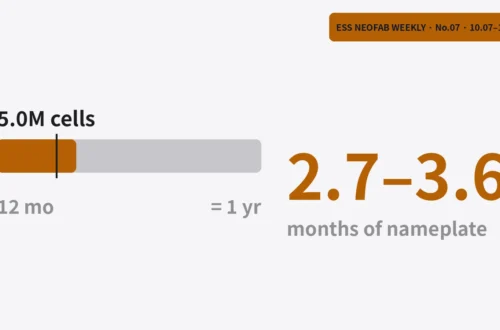
Five million ACC cells equal 2.7 to 3.6 months of nameplate output