-
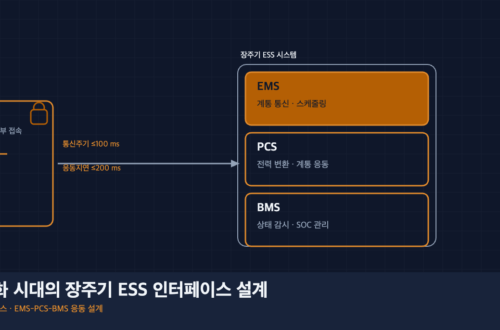
Long-Duration ESS Interface Design in the Era of Power-Grid Saturation
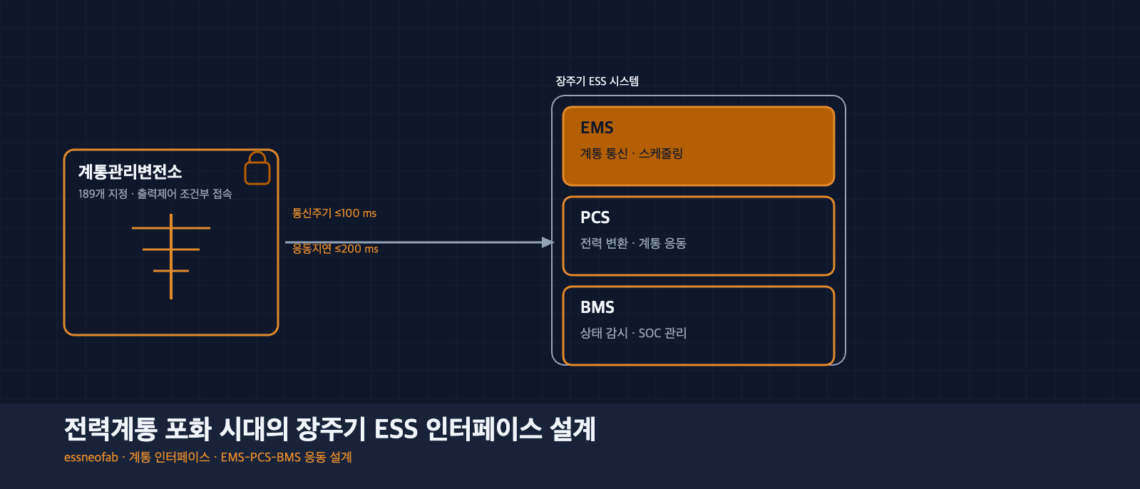
As 189 grid-management substations nationwide have, starting in 2026, been restricting new interconnection of renewable energy and large-scale demand through conditional curtailment, long-duration ESS (Energy Storage System) is shifting from a simple generation-consumption buffer into an essential variable in grid interface design. Korea's Ministry of Trade, Industry and Energy's centralized-contract market has presented a target of securing approximately 0.5 GW annually from 2026 to 2029, and a cumulative 21.5 GW by 2038, of long-duration ESS, which translates directly into standardization pressure on the communication and response specifications across the three-tier BMS-PCS-EMS hierarchy. In the current structure, where grid-interconnection queue information is not disclosed, designing margin into an individual ESS system's…
You May Also Like
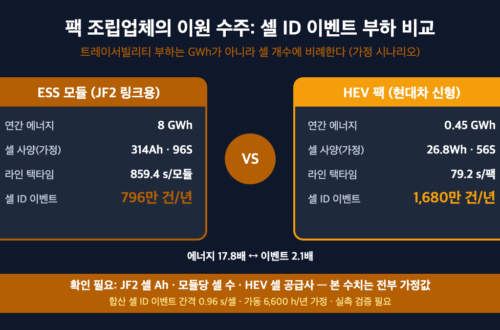
Sebang Lithium Battery’s Simultaneous HEV Pack and ESS Module Orders — Analyzing the Cell-Inbound Interface and Cell-ID Traceability Load
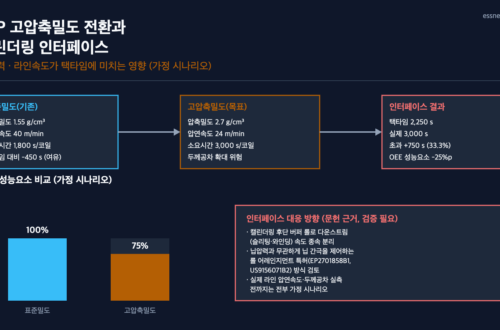
LFP High-Compaction-Density Conversion and the Calendering Interface: How Nip Pressure and Line Speed Affect Takt Time
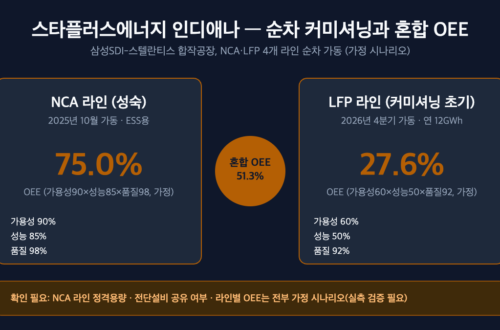
StarPlus Energy’s Indiana Plant — The Blended-OEE Illusion Created by Sequential NCA/LFP Commissioning
-
ESS Assembly Line: Why Immersion Cooling Becomes a Bottleneck
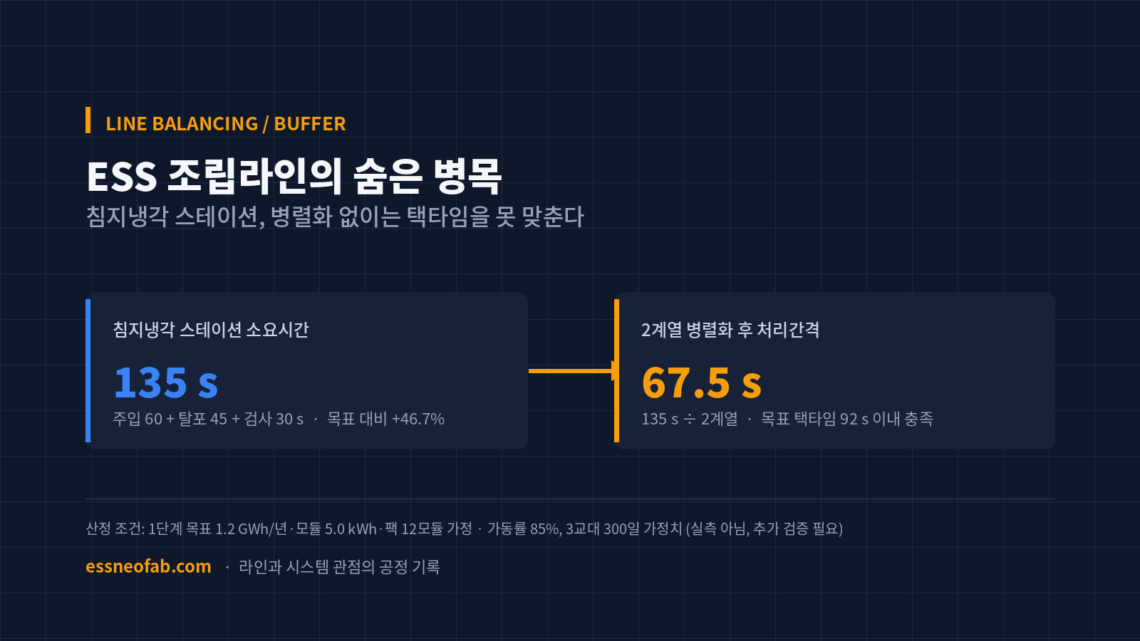
This article addresses the line-balancing problem that arises when immersion cooling and AI cell monitoring are simultaneously integrated in-line into an ESS module-pack assembly line. Under the estimation scenario, the immersion-cooling station's process time is 135 s, exceeding the target module takt time of 92 s by 46.7%, making a bottleneck unavoidable with a single-station configuration. Parallelizing into 2 lines lowers the effective processing interval to 67.5 s, satisfying the takt-time condition, but this in turn raises the FIFO buffer size at the point where the two lines merge, and the module-serial tagging of AI monitoring data, as new interface risks. This estimation is a scenario based on assumed values…
-
Converting EV Lines to ESS: Where Does OEE Break Down?
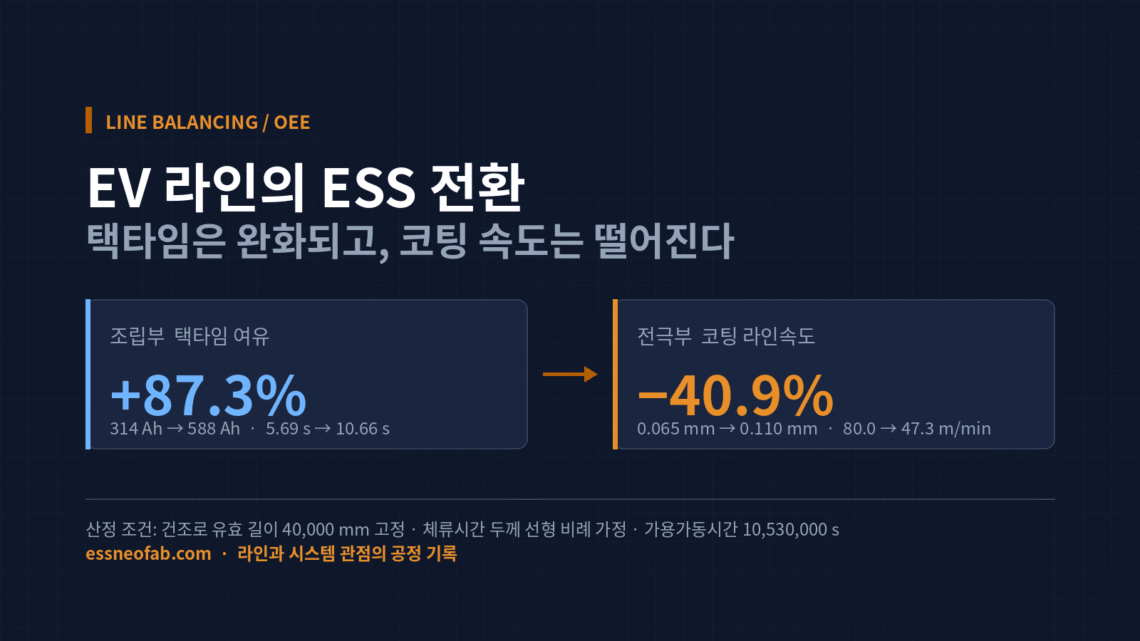
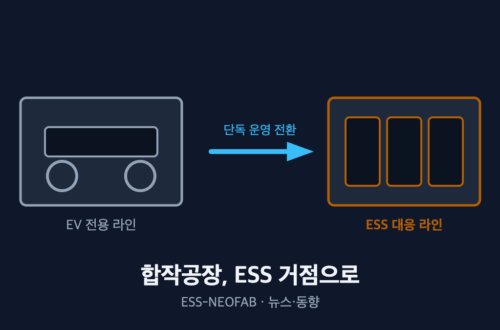
When converting an EV cell line for ESS use, retrofit effort and budget tend to concentrate on the assembly process. However, when a thick-film electrode and a large prismatic cell format are applied simultaneously while the drying-oven length remains fixed, the takt-time margin in the assembly section increases by 87.3% while the coating-section line speed drops by 40.9%. The conversion bottleneck shifts from assembly to the electrode section, and CAPEX priority should be reallocated accordingly. Furthermore, failing to update the abnormal-cycle-time baseline by part number books up to 36.3 percentage points of phantom performance loss into OEE, causing the improvement organization to chase a loss that does not exist. 1.…
-
Converting EV Lines to ESS: What the H1 Utilization Gap Reveals About Line-Conversion Speed
In H1 2026, utilization rates at the three major domestic battery makers' plants diverged based on how quickly each converted its lines to ESS use amid weak EV demand. LG Energy Solution and Samsung SDI sharply raised utilization through faster conversion and by securing new demand outlets (ESS, BBU), while SK On's utilization actually declined due to delayed conversion. This is not a matter of individual equipment performance, but of the speed of line-level decision-making. This article compares the three companies' utilization changes from a line-reconfiguration perspective. 1. What Happened U.S. EV demand is weak. The three battery makers all faced the same market environment. So why did their utilization…
-
Dry Electrode: Where Does the Line Bottleneck Move?
Converting to a dry electrode process eliminates the drying-oven section of a wet-coating line, but the claim that this improvement, by itself, shortens line takt time does not hold. When both the physical length and the time buffer that the drying oven provided disappear at once, the bottleneck shifts to the electrode-formation/lamination section and the quality-inspection section, and the degrees of freedom available for buffer design actually shrink. Separately, an industrial-park zoning deregulation announced in August 2026 adds battery-recycling businesses to the eligible occupants of the Gumi and Pohang national industrial complexes, changing the logistics-interface conditions outside the line. This article examines both changes together at the line/system level, and…
You May Also Like
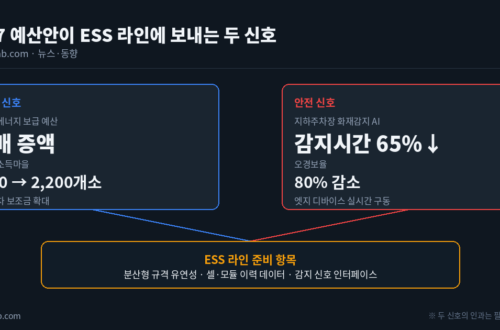
Doubling the Renewable-Energy Budget and Underground-Parking EV Fire-Detection AI — Two Signals the 2027 Budget Sends to the ESS Line
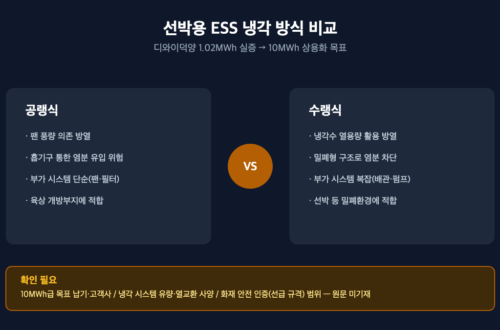
DY Duckyang’s 10 MWh-Class Marine ESS — What the Water-Cooled Demonstration Means for System Design
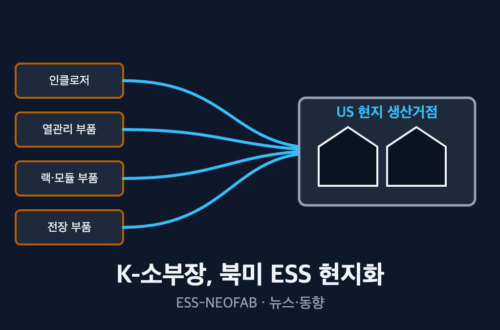
“Capturing the U.S. ESS Market” — K-Battery Supply Chain’s Wave of Localization: What’s Going Where
-
Solid Electrolyte and Aqueous Zinc Batteries: Investment Is Up — Is the Line Ready?
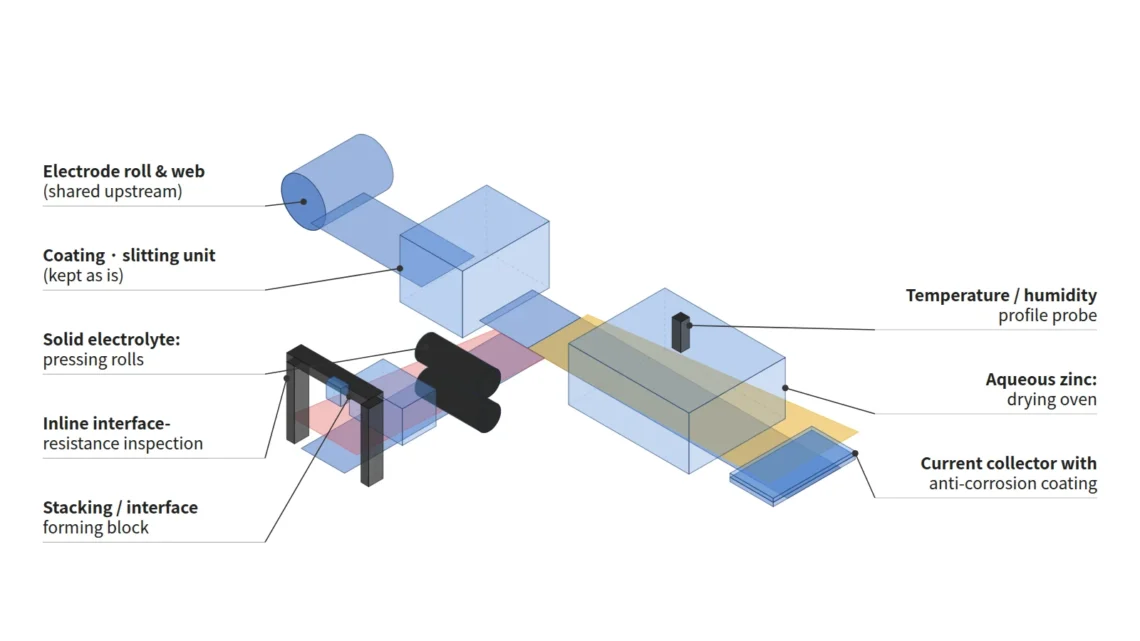
In August 2026, two domestic battery-material startups raised large investment rounds in quick succession. A solid-electrolyte specialist secured KRW 23.0 billion in a Series C round, and an aqueous zinc-ion battery company secured KRW 22.0 billion in a Series A round. Both companies handle materials whose process conditions differ from the conventional lithium-ion system, so from a shop-floor standpoint, the more important question is not the investment news itself but "what changes once this material actually reaches a mass-production line." Key Points at a Glance CategorySolid ElectrolyteAqueous Zinc-Ion Battery Funding roundSeries CSeries A Funding amountKRW 23.0 billionKRW 22.0 billion Difference from conventional lithium-ionThe liquid-electrolyte impregnation process itself disappears or shrinksUses…
You May Also Like
K-BATTERY SHOW 2026 Fire Safety Seminar: What to Look for in a Line-Level Fire Response System
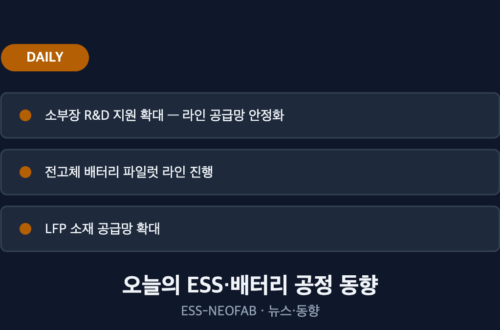
Today’s ESS/Battery Process Trends — Expanded Support for Materials/Parts/Equipment Lines, Solid-State/LFP Pilot Lines Launch (2026.08.07)
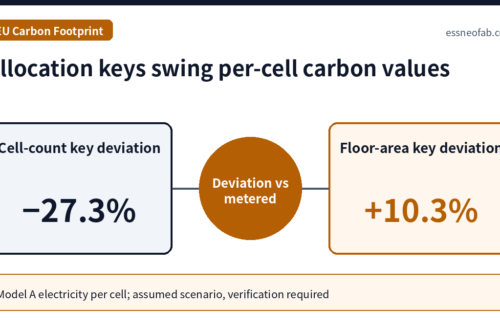
EU Battery Carbon Footprint Methodology Still Pending: How Line Energy Metering Resolution and Allocation Choice Shift Per-Cell Values
-
K-BATTERY SHOW 2026 Fire Safety Seminar: What to Look for in a Line-Level Fire Response System
K-BATTERY SHOW 2026 was held from September 9 to 11, 2026, in Hall 7 of KINTEX Exhibition Center 2, with 185 exhibiting companies and 15,311 visitors over three days. The exhibition featured a special EV fire-response pavilion gathering fire prevention, detection, and suppression technologies, and the SFPE Korea Chapter’s “2026 International Lithium Battery and EV Fire Safety Seminar” shared thermal-runaway prediction and suppression technologies. This article treats line-level fire response as a closed loop of three serially connected segments (detection, isolation, and suppression) and shows that, in an assumed scenario, suppression-discharge delay accounts for 54 % of the loop’s total response time of 18.5 s. In other words, the performance…
You May Also Like
Doubling the Renewable-Energy Budget and Underground-Parking EV Fire-Detection AI — Two Signals the 2027 Budget Sends to the ESS Line
Today’s ESS/Battery Process Trends — Expanded Support for Materials/Parts/Equipment Lines, Solid-State/LFP Pilot Lines Launch (2026.08.07)
DY Duckyang’s 10 MWh-Class Marine ESS — What the Water-Cooled Demonstration Means for System Design
-
Inter-Process Buffers: Bigger Isn’t Always Better
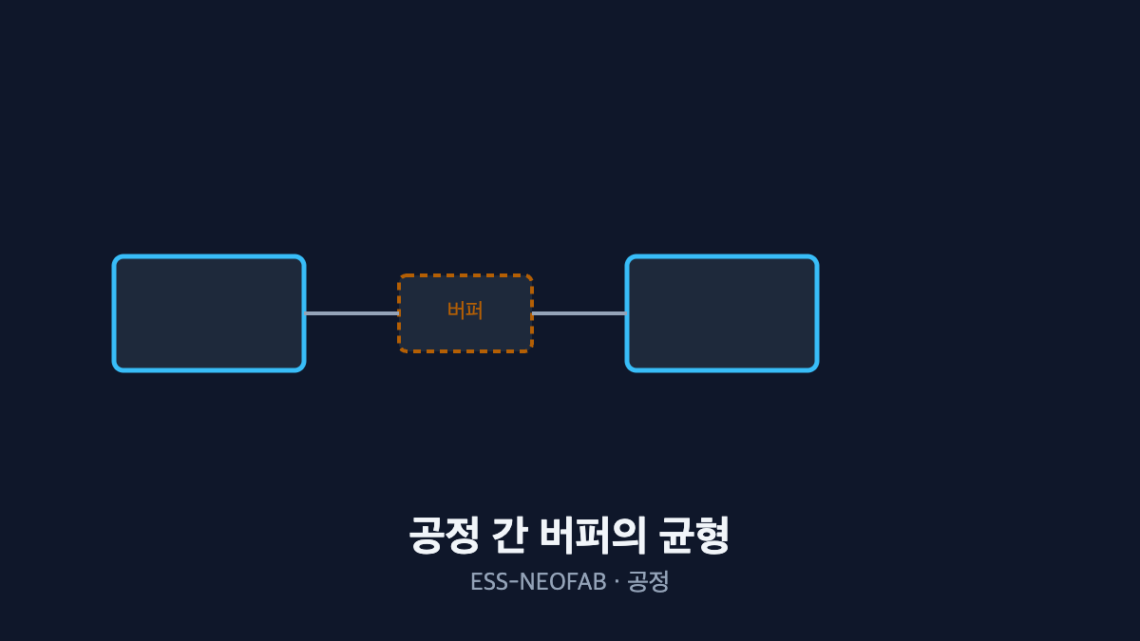
An inter-process buffer (work-in-process inventory) is not a device that gets safer as it grows. It is a range problem, bounded below by what availability demands and above by what quality tolerates. Under the assumed line conditions below, the availability-driven minimum is 2 coils while the quality-driven maximum is 1 coil — the two bounds conflict. That conflict is not resolved by enlarging or shrinking the buffer; it is resolved by reducing upstream MTTR (Mean Time To Repair) or by moving the defect-detection point ahead of the buffer. Every figure below is an assumed value set for illustration, and applying it 1:1 to a mass-production line requires separate verification. 1.…
You May Also Like
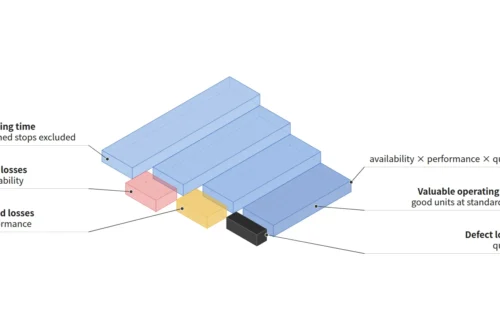
If Availability, Performance and Quality Are All 80 %, OEE Is 51.2 % — How to Calculate OEE
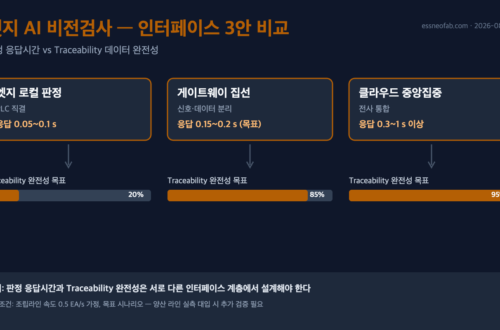
Edge AI Vision Inspection and Battery-Pack Leak Testing: How Gateway Aggregation Affects Traceability Completeness
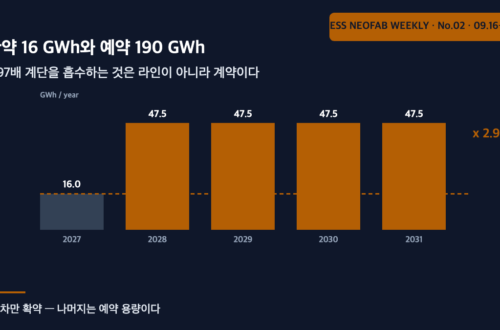
16 GWh committed and 190 GWh reserved — what absorbs the 2.97x step is the contract, not the line
-
Cell Traceability: Where Does It Break Down at the Line Level?
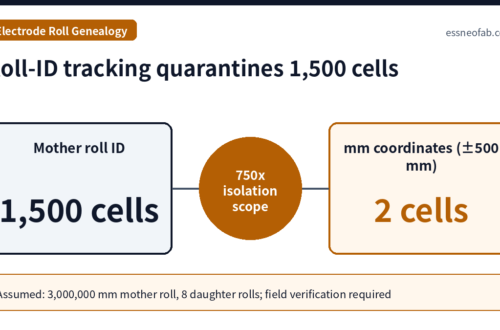
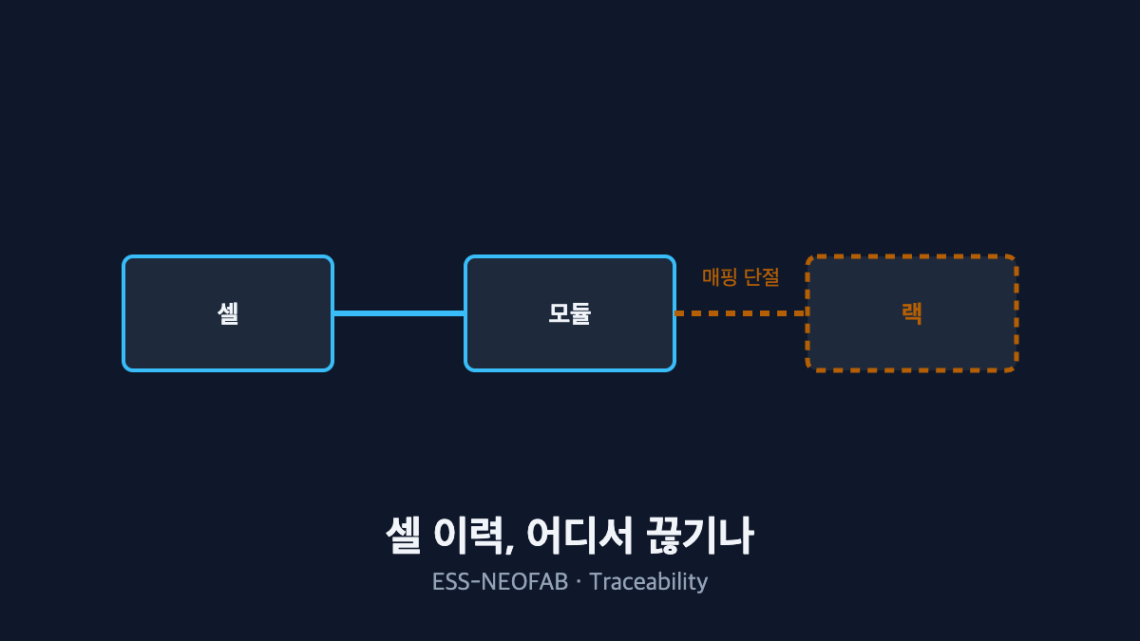
The value of traceability is measured by one thing only: how far it narrows the recall scope when a defect appears. What matters is not the precision of cell-level data but whether the mapping survives each process boundary — and when one mapping link breaks, the recall scope does not grow by addition but is multiplied by that level's capacity. Under the assumed site configuration below, a missing module-to-rack-slot mapping widens the suspect population from 24 cells to 480, a factor of 20. Every figure below is an assumed value for illustration and must be recalculated against an actual site configuration. 1. The Conclusion First — The Cost of a…
You May Also Like
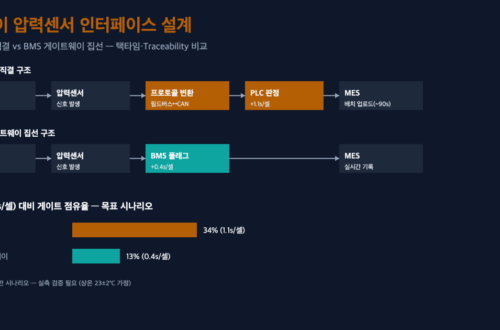
46-Phi Cylindrical Cell Line Conversion: The Pressure-Sensor–BMS Interface Determines Takt Time
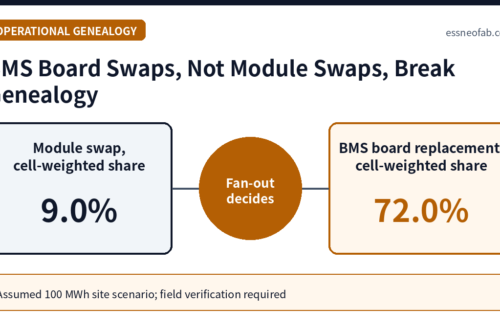
Serial Genealogy in ESS Operation: Where Module Swaps, Refurbishment and BMS Board Replacements Break Parent-Child Links
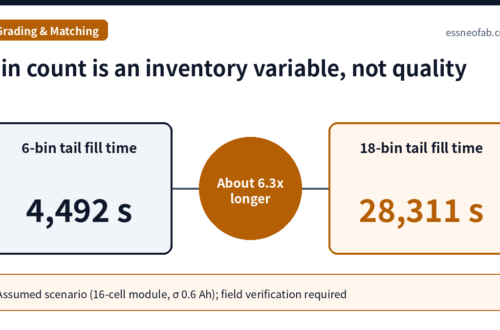
Cell Grading Bin Count and Grade-Specific WIP: What Module Matching History Must Retain
-
Between the Battery Rack and the PCS: Two Points Where the Interface Diverges
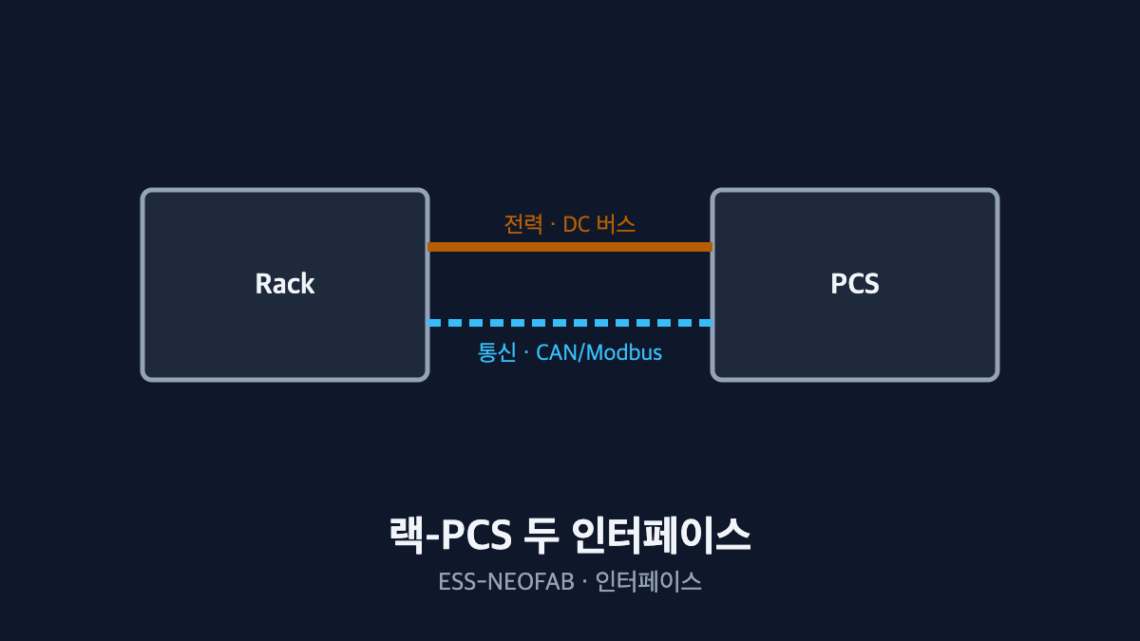
A battery rack and a PCS look like they are joined by a single cable, but two interfaces — power and communication — must line up simultaneously before the system will come up. On the power side, changing the number of series cells in a rack shifts both ends of the DC voltage window at once, so checking one end leaves the PCS unable to start in the low-SOC region. On the communication side, the register map and scale factors sit outside what the standard defines, so a single unit mismatch makes SOC read ten times high. Every figure below is an assumed value for illustration and must be recalculated…
You May Also Like
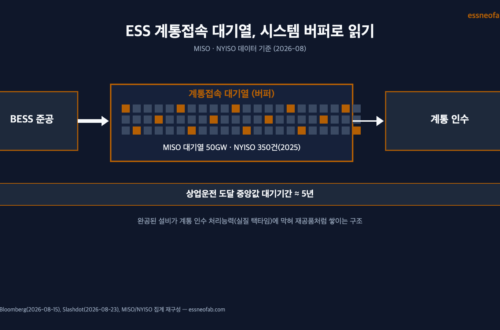
Re-Reading the ESS Grid-Interconnection Queue in the Language of Line Balancing
46-Phi Cylindrical Cell Line Conversion: The Pressure-Sensor–BMS Interface Determines Takt Time
Edge AI Vision Inspection and Battery-Pack Leak Testing: How Gateway Aggregation Affects Traceability Completeness