-
ESS Fire Investigation and Traceability: Decomposing Reverse-Trace Time from the Incident Rack to Same-Lot Sites
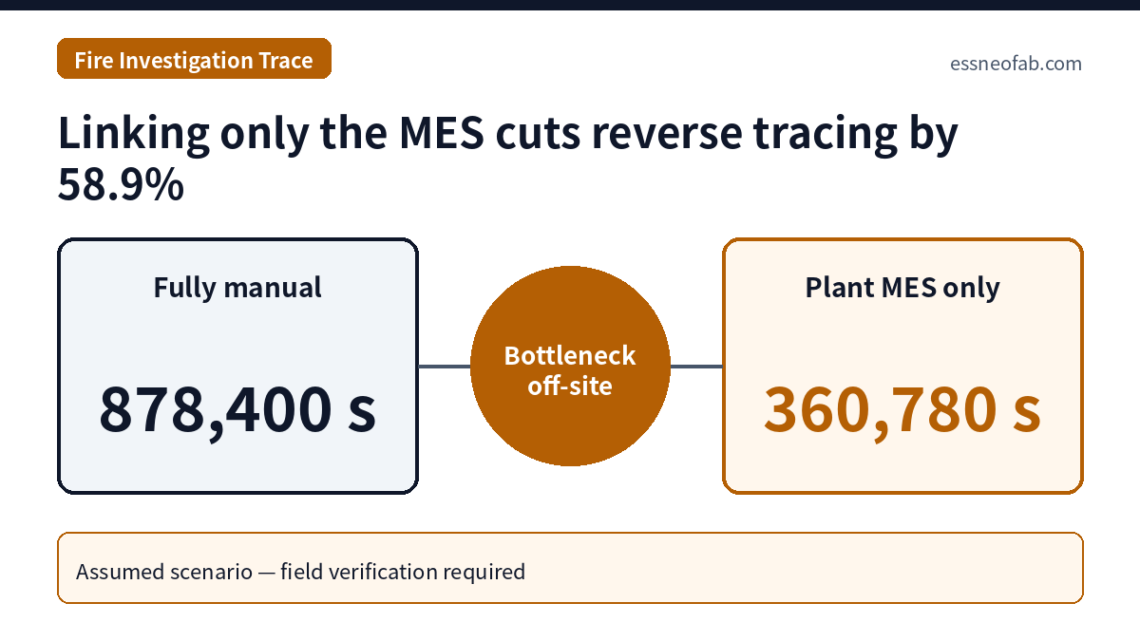
According to EPRI's 2024 white paper, only 26 of the 81 incidents (32.1%) in its BESS Failure Incident Database had sufficient information to assign a root cause, and the loss of physical evidence after fire was cited as the reason manufacturing defects were the least-classified root cause. What remains once physical evidence has burned is the linked data stored outside the site, namely traceability. Decomposing a five-step reverse trace from one incident rack to cell lot, process parameters, and the installation positions of the same lot at other sites under an assumed scenario gives 878,400 s for a fully manual path and 1,710 s for a fully connected database. However,…
You May Also Like
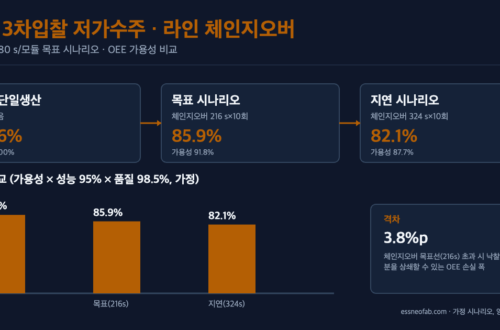
Line Changeover Design in the Era of Low-Price ESS Round-3 Bidding — Flexible Assembly Viewed Through Takt Time and OEE
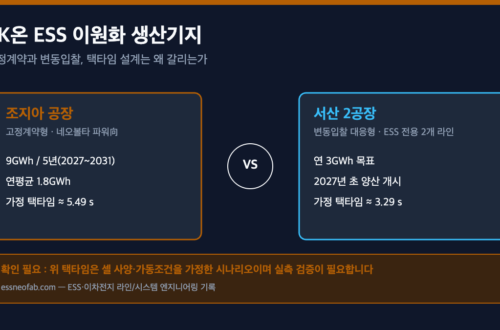
SK On’s Dual-Site ESS Production Bases — Where Fixed Contracts and Variable Bidding Split Takt Time Design
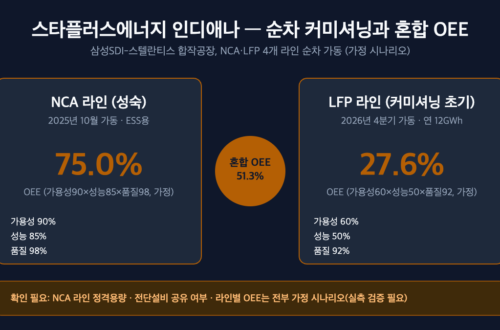
StarPlus Energy’s Indiana Plant — The Blended-OEE Illusion Created by Sequential NCA/LFP Commissioning
-
Cell Grading Bin Count and Grade-Specific WIP: What Module Matching History Must Retain
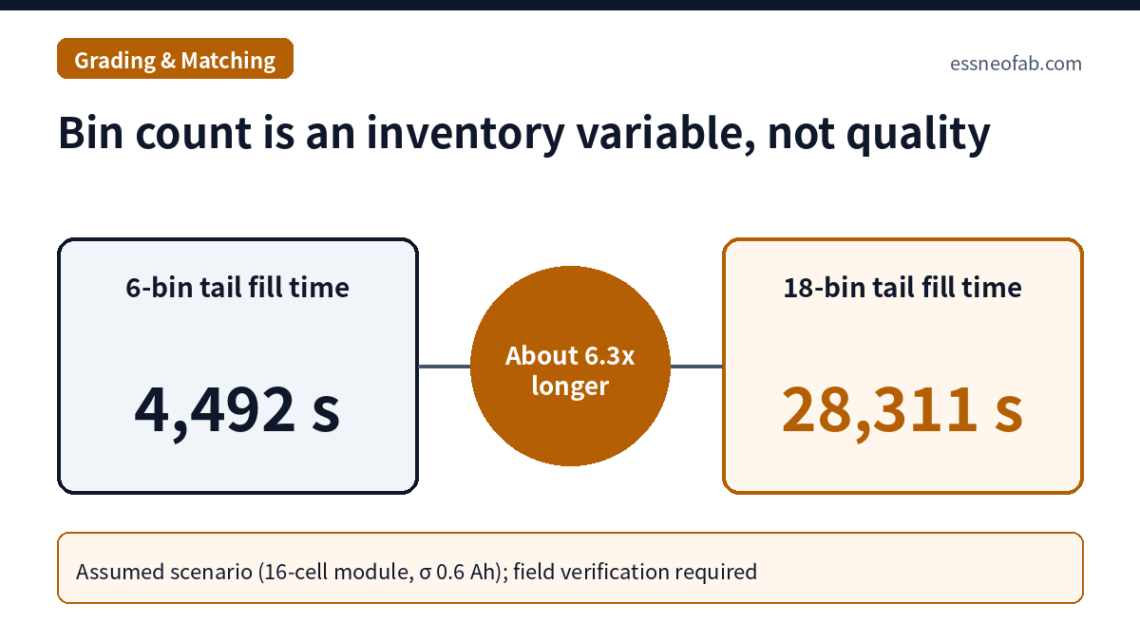
Increasing the number of cell grading bins reduces within-module capacity spread in proportion to bin width, but grade-specific waiting WIP rises in proportion to bin count, and the time for the rarest tail bin to fill one module's worth of cells rises faster still. On an assumed line of about 4.46 million cells per year with 16-cell modules, going from 6 bins to 18 bins (6 capacity × 3 internal resistance) leaves the 0.6 Ah capacity bin width unchanged while raising average partial-fill WIP from 45 to 135 cells and tail-bin fill time from about 4,492 s to about 28,311 s. During ramp-up (operating at 30% of rated rate) this…
You May Also Like
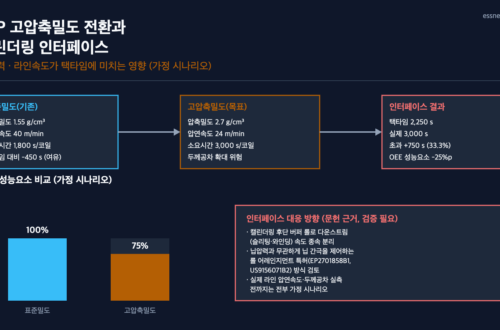
LFP High-Compaction-Density Conversion and the Calendering Interface: How Nip Pressure and Line Speed Affect Takt Time
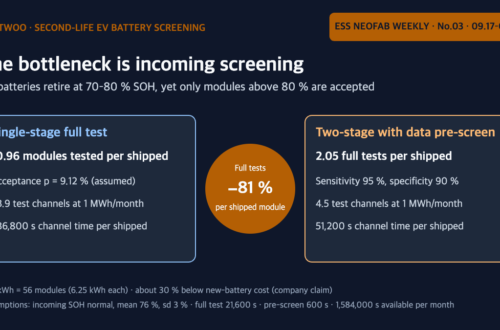
Battwoo’s Second-Life EV Batteries — When an 80 % Acceptance Threshold Overlaps the Retirement Distribution, Incoming Screening Becomes the Bottleneck
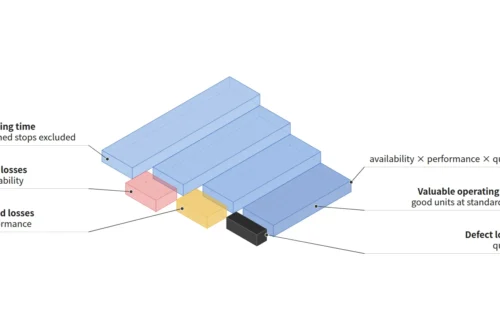
If Availability, Performance and Quality Are All 80 %, OEE Is 51.2 % — How to Calculate OEE
-
Market Trends from a Battery Process/Equipment Perspective — 46-Phi Ramp-Up, Dry Process, Equipment In-Housing
The battery process/equipment market covers the equipment used in cell-manufacturing processes — mixing, coating, calendering, slitting, winding/stacking, assembly, and formation — and the changes in its technical specifications. This article summarizes recent trends centered on three streams: the shift to the cylindrical 46-phi form factor, the dry electrode process, and equipment in-housing/efficiency improvement. 1. Mass-Production Ramp-Up and Process Upgrades for Cylindrical Batteries (46-Phi and Others) LG Energy Solution's new cylindrical lines (2 units) at Nanjing Plant 9 to start operation in the second half of the year: Expansion pursued at 2GWh per line. Ramp-up accelerated by benchmarking the Shanghai Plant 6 model (30GWh) supplying Tesla. Tesla Giga Berlin production increase…
You May Also Like
LFP High-Compaction-Density Conversion and the Calendering Interface: How Nip Pressure and Line Speed Affect Takt Time
Battwoo’s Second-Life EV Batteries — When an 80 % Acceptance Threshold Overlaps the Retirement Distribution, Incoming Screening Becomes the Bottleneck
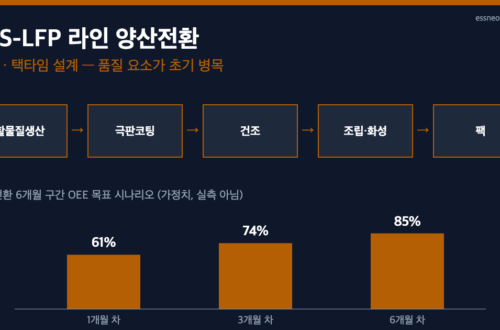
The Equipment Maker’s Line-Ownership Shift — OEE and Takt-Time Design During the ESS-LFP New-Line Mass-Production Ramp-Up
-
Linking Cell History in Formation and Aging: History Contamination from Tray ID + Slot Mapping
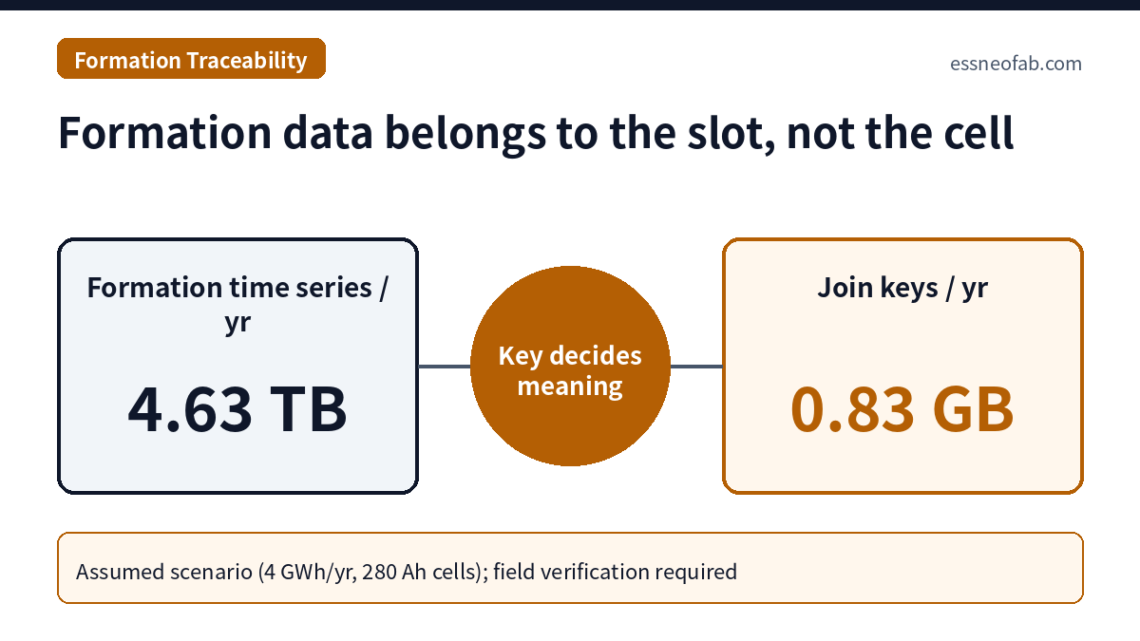
Measurement data in the formation and aging section are generated against equipment channels and tray slots, not against cell IDs; the completeness of cell history is therefore determined not by measurement accuracy but by the integrity of a join key composed of tray ID + slot position + load event. On an assumed line processing about 4.46 million cells per year, formation time series occupy about 1.04 MB per cell and about 4.63 TB per year, while the join-key record is 186 byte per cell, less than 0.02% of the total. Yet a slot misplacement rate of only 10 ppm per load event contaminates the history of about 268 cells…
You May Also Like
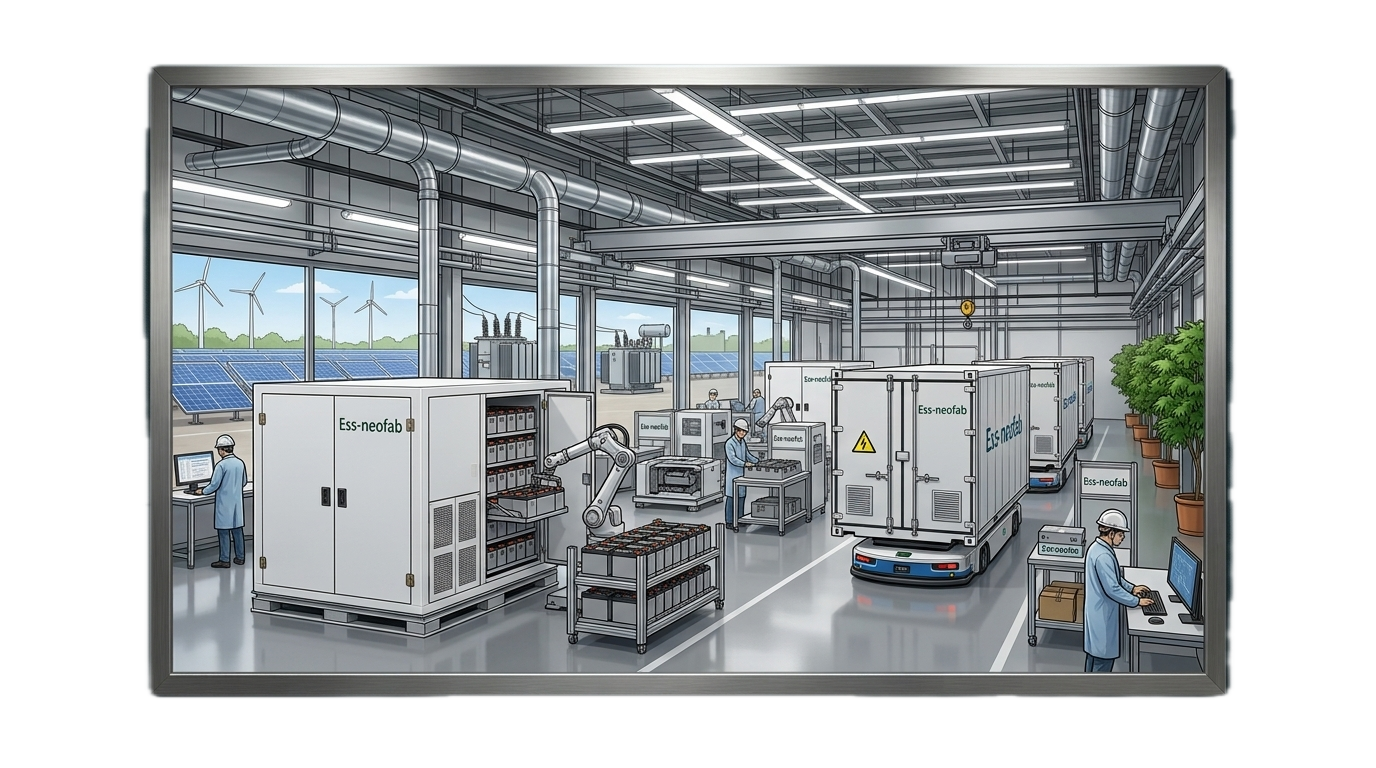
Market Trends from a Battery Process/Equipment Perspective — 46-Phi Ramp-Up, Dry Process, Equipment In-Housing
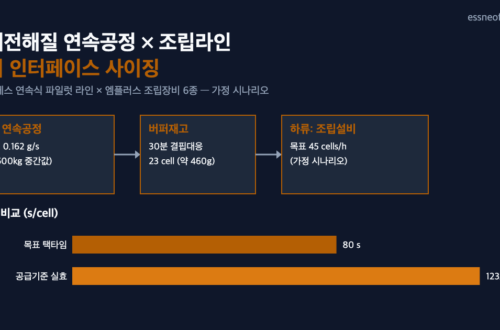
Between the Continuous Solid-Electrolyte Process and the Assembly Line: How Should the Buffer Interface Be Designed?
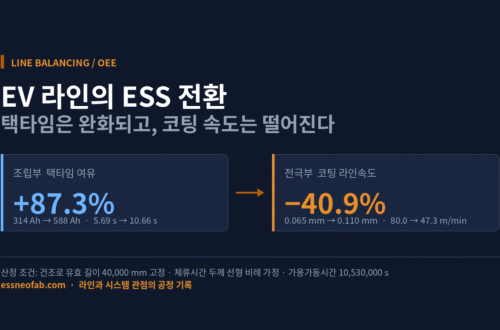
Converting EV Lines to ESS: Where Does OEE Break Down?
-
After Korea’s Battery History Management System: IDs Continue, Operating History Breaks — History Continuity of ESS Reuse Racks
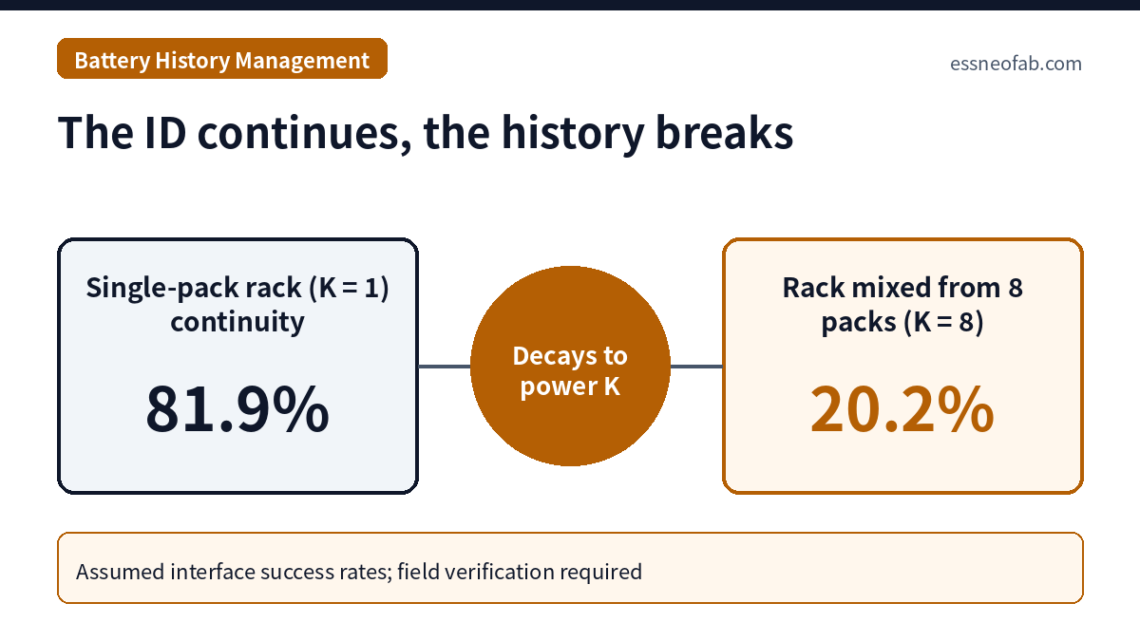
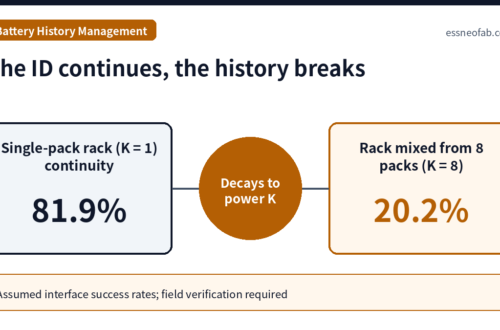
Korea's battery history management system under the amended Motor Vehicle Management Act, in force since 17 February 2025, requires the battery identification number assigned at the manufacturing stage to be registered in the vehicle registration record and tracked through operation and scrapping; the Used Battery Act promulgated in May 2026 (in force 27 May 2027) and the August 2026 agreement between the industry and climate-environment ministries on an integrated platform now extend it to later stages. Yet when assumed success rates are compounded across the six lifecycle interfaces, identification-number continuity is 91.0% while history continuity, including BMS operating data, falls to 81.9%. The larger variable lies in the reuse stage.…
You May Also Like
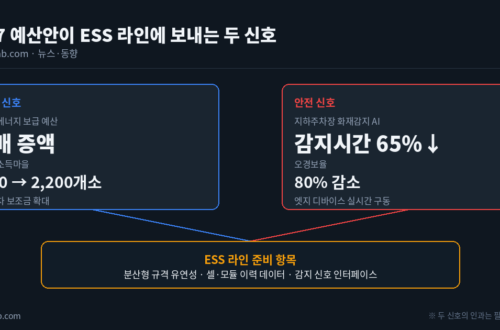
Doubling the Renewable-Energy Budget and Underground-Parking EV Fire-Detection AI — Two Signals the 2027 Budget Sends to the ESS Line
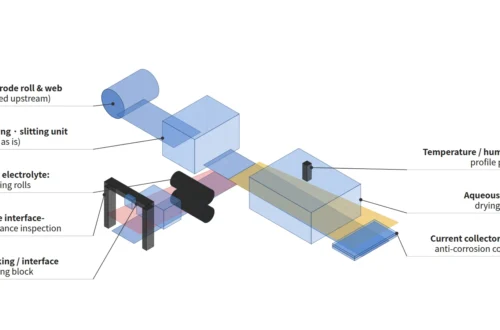
Solid Electrolyte and Aqueous Zinc Batteries: Investment Is Up — Is the Line Ready?
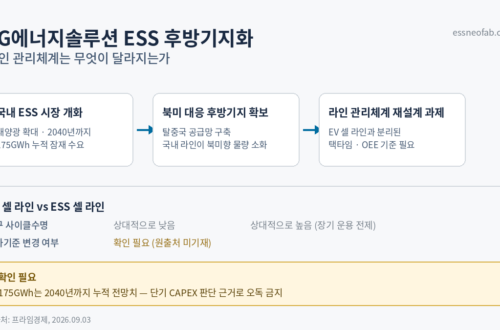
LG Energy Solution’s ESS Rear-Base Positioning — What Changes in Line Management
-
Linking BMS Operating History to the Battery Passport: Why Sampling and Retention Must Be Separated
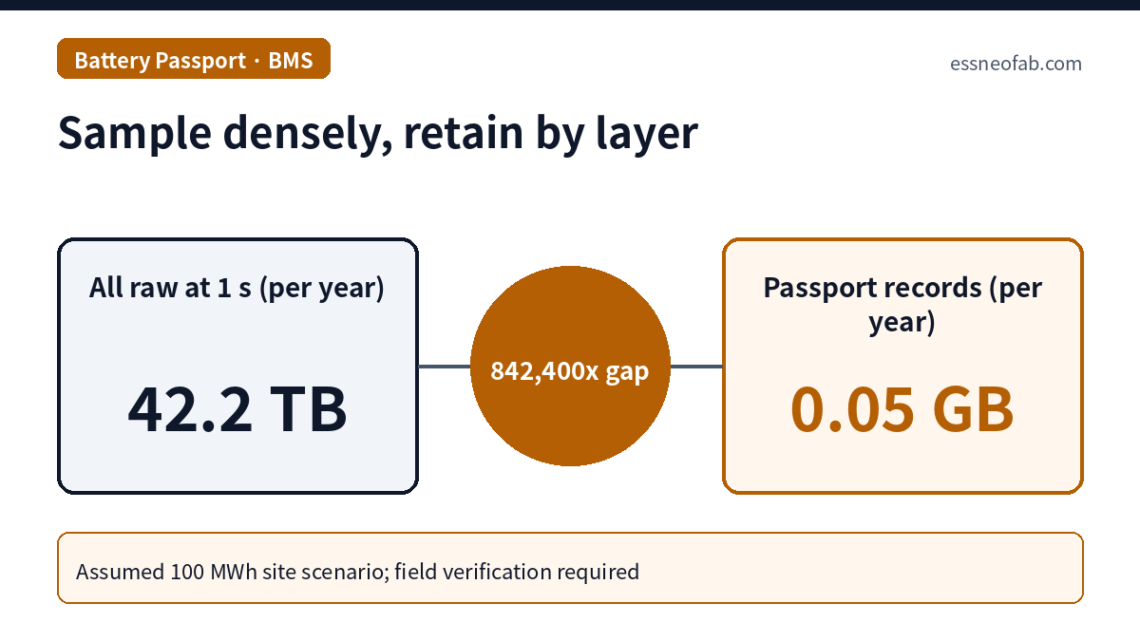
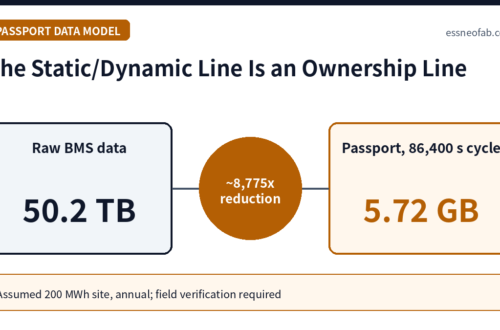
When the dynamic BMS data required by Article 14 and Annex VII of the EU Battery Regulation (Regulation (EU) 2023/1542) is linked to the battery passport[1], the variable that determines data volume is not the sampling period but which layer retains what. At a site of roughly 100 MWh (111,488 cells, assumed), retaining all raw cell data at 1 s accumulates 42.2 TB per year and 421.9 TB over 10 years, whereas aggregating the Annex VII parameters into daily rack-level records yields about 0.05 GB per year, roughly 1/840,000 of that. Conversely, sampling a 20 s abnormal event at a 60 s period drops the detection probability to 33.3%. A…
-
EU Battery Carbon Footprint Methodology Still Pending: How Line Energy Metering Resolution and Allocation Choice Shift Per-Cell Values
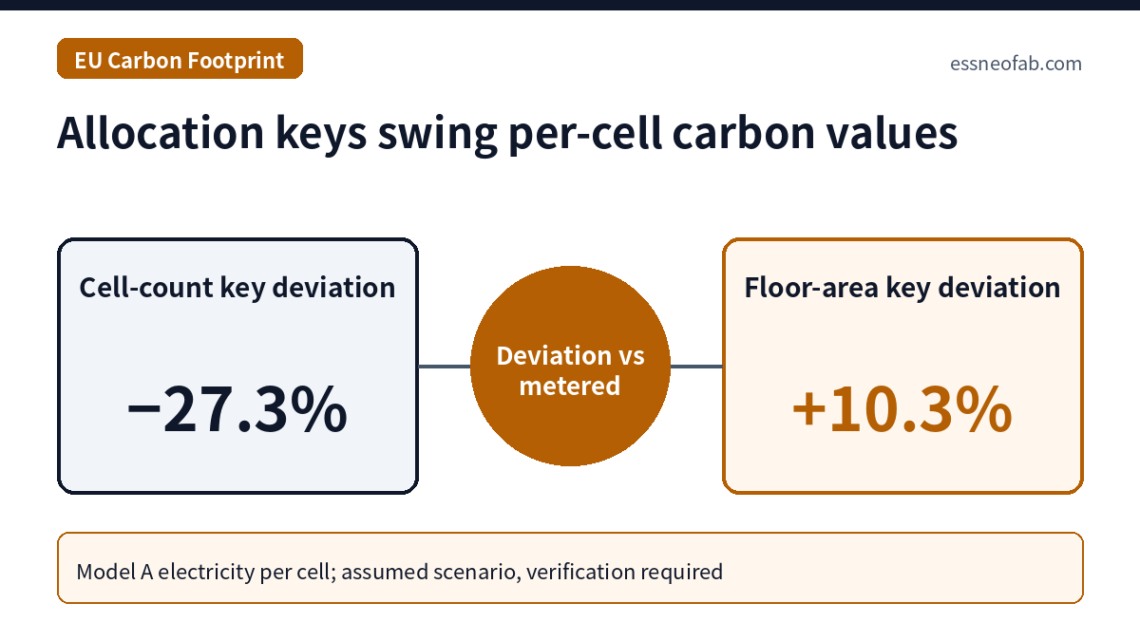
According to the EU's official consultation portal, the delegated act setting the carbon footprint calculation methodology under Article 7 of the EU Batteries Regulation (2023/1542) had not moved to the adoption stage as of 23 September 2026, and the portal still shows the planned adoption period as "Q3 2025". In an assumed 8 GWh/year plant producing two models, allocating the same 200,000,000 kWh of electricity by floor area, operating time, capacity or cell count makes the per-cell electricity of model A swing from −27.3% to +10.3% against the process-metered value of 7.860 kWh. Area-based allocation reverses the low-carbon ranking of the two models, and capacity-based allocation has the smallest total…
You May Also Like
K-BATTERY SHOW 2026 Fire Safety Seminar: What to Look for in a Line-Level Fire Response System

From EV to ESS Use: What Ultium Cells and Cosmos Lab Show About Converting a Line’s Purpose
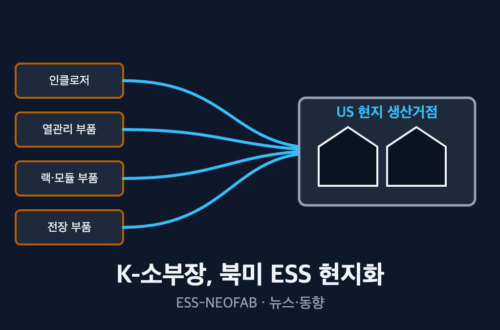
“Capturing the U.S. ESS Market” — K-Battery Supply Chain’s Wave of Localization: What’s Going Where
-
Recall and Quarantine Scope vs Traceability Resolution: Lot Tracking Compared with Cell-Plus-Parameter Tracking
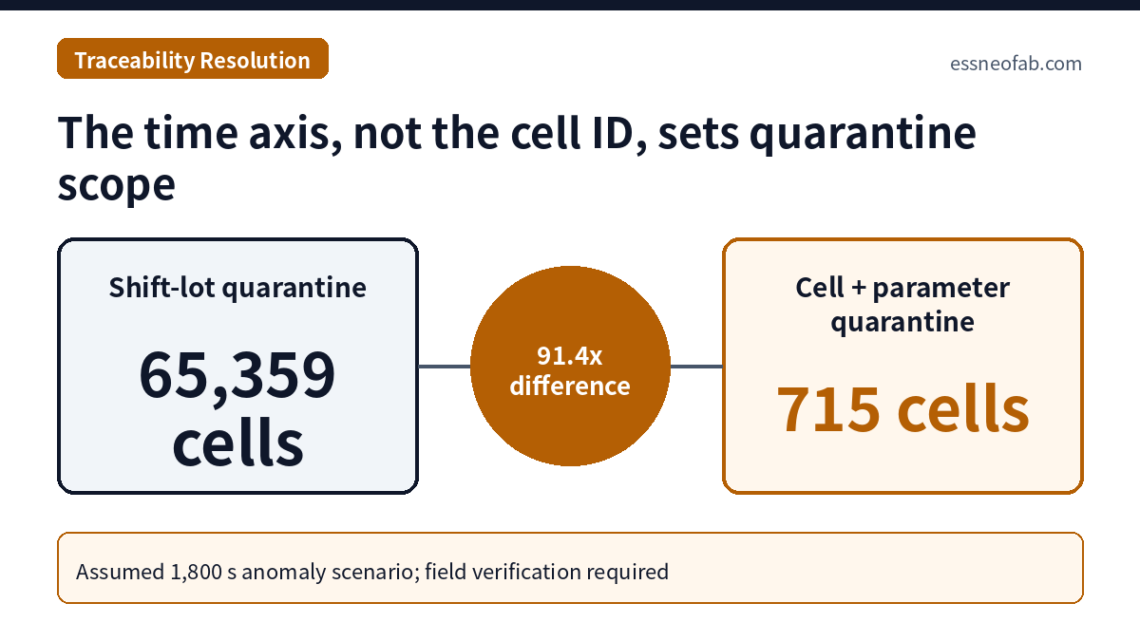
On an assumed line producing 25,000,000 cells per year, a process anomaly lasting 1,800 s at one station leads to a quarantine population of 196,078 cells at lot level (production-day lot plus adjacent lot), 65,359 cells at shift-lot level, 2,159 cells with cell-to-tray mapping, 2,045 cells with per-cell timestamps, and 715 cells with per-cell process-parameter linkage. The main lever that narrows the quarantine scope by roughly 30× is not the cell ID itself but time-axis resolution (lot → tray); per-cell parameter linkage narrows it by a further ~2.9×. Under 10-year retention, storage cost is below 0.1% of the quarantine cost of a single anomaly at shift-lot level, so the real…
You May Also Like
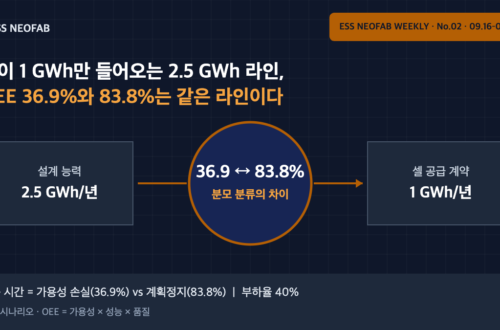
A 2.5 GWh Line Fed Only 1 GWh of Cells — OEE of 36.9% and 83.8% Describe the Same Line
Line Changeover Design in the Era of Low-Price ESS Round-3 Bidding — Flexible Assembly Viewed Through Takt Time and OEE
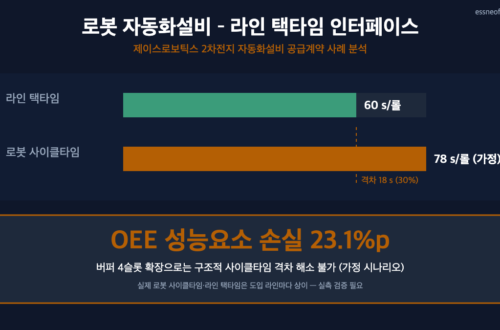
Introducing Robotic Automation Equipment — Where Does the Interface with Line Takt Time Break Down
-
Serial Genealogy in ESS Operation: Where Module Swaps, Refurbishment and BMS Board Replacements Break Parent-Child Links
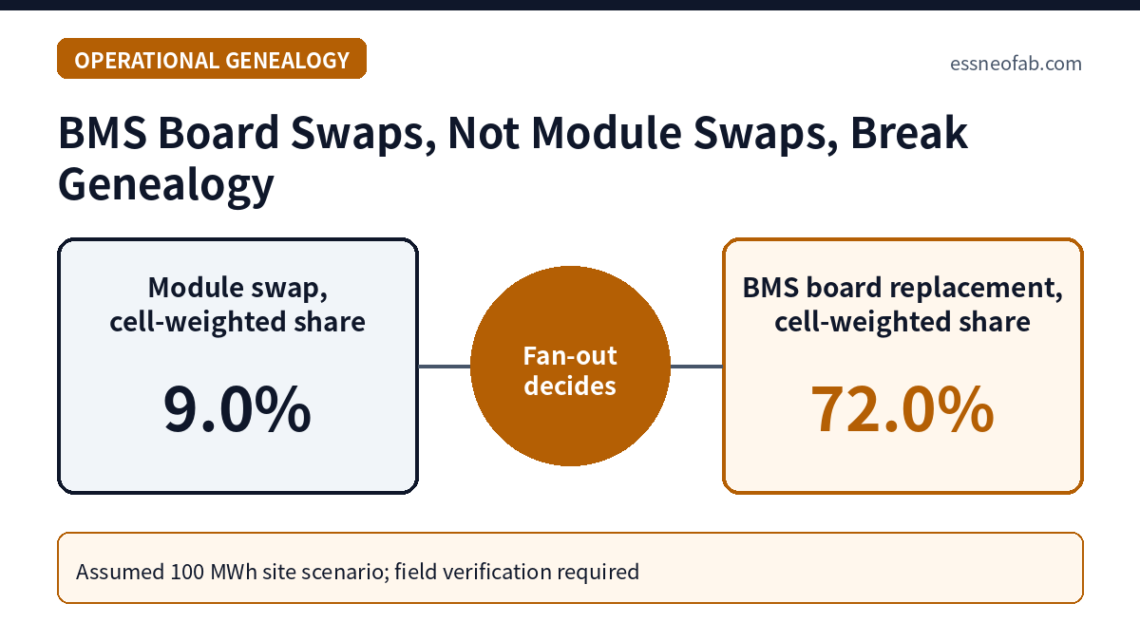
After shipment, genealogy mismatches at an ESS site accumulate less from module swaps, which are managed as genealogy events, than from BMS board (BMU/BCU) replacements, which are not recognized as genealogy events at all. Assuming annual replacement rates and record-omission rates for a 100 MWh site (99,840 cells, 1,920 modules, 240 racks), cells whose parent chain cannot be verified accumulate at 554 per year and 5,541 over 10 years (5.55% of the total), with 72.0% originating from board replacements. Module swaps account for 25.3% by event count but only 9.0% when weighted by cells. Since Article 77(7) of the EU Batteries Regulation requires repurposed and remanufactured batteries to carry a…
-
Traceability Events at the ISA-95 L2→L3 Boundary: How OPC UA Polling, Subscriptions and MES Handshakes Erode Takt Time
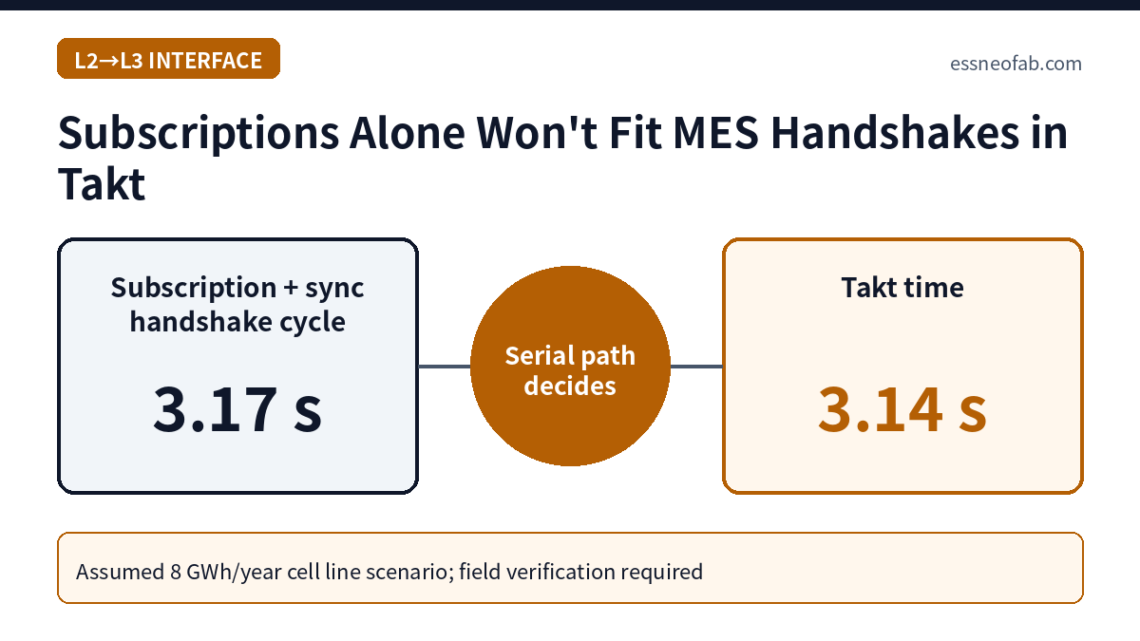
At the boundary between equipment (ISA-95 Level 2) and MES (Level 3), the main reason traceability events erode takt time is not the transport method (polling vs. subscription) but a structure in which the MES acknowledgement (handshake) sits serially on the critical path of the station cycle. On an 8 GWh/year cell line (assumed takt time 3.14 s, net station processing 2.80 s), 1.0 s polling with a synchronous handshake adds an average of 0.72 s, stretching the cycle to 3.52 s and creating a shortfall of about 10.9% against required quantity; switching to a 0.1 s/0.2 s subscription still adds 0.37 s on average and still exceeds takt time.…